Model Scaling
This page provides a set of recommendations for managed processes configuring Kubernetes nodes for optimal ML model inference performance.
It offers ML engineers, MLOps practitioners, and others the best methods for scaling deployed ML models for optimal performance when used with Cortex Certifai.
The following assumptions are made in this guide:
- Your ML models are packaged in containers and deployed to a Kubernetes cluster.
- The K8s cluster your ML model is deployed to may be different from the one where your Cortex Certifai Enterprise (CCE) instance runs.
- You have administrative control over the K8s clusters that is running the ML models and CCE instance, and you are able to apply configuration changes to the nodes in those clusters.
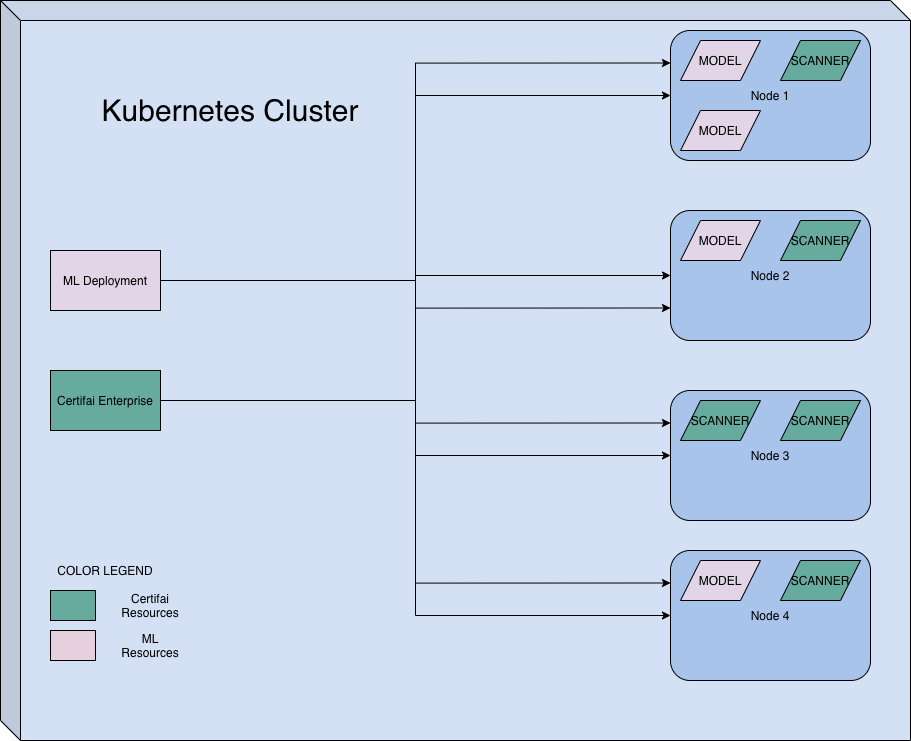
The following diagram illustrates a typical Kubernetes deployment of an ML model web service. It is on a Kubernetes cluster that contains deployments of an ML model as well as Certifai Enterprise. You can see that the pods corresponding to the ML model and the Scanner (Certifai Enterprise) are distributed across the nodes unevenly. This needs to be corrected for optimal performance.
Kubernetes Node Management
A Kubernetes administrator can configure the nodes in your cluster with taints and tolerations so that the pods for an ML Model and Certifai Scanner do not have to contend with each other for CPU or memory resources.
For example, in the figure above, Nodes 1, 2 and 4 have a mixture of pods for the ML Model and the Certifai Scanner. This violates recommended guidelines because both workloads require extensive CPU resources, which may lead to resource contention on those nodes.
Since the Certifai scanning algorithm puts each ML Model web service under a high amount of load, the resource requirements for the Certifai Scanner pods and the ML model web service increases as time goes on.
Having both the ML Model and the Certifai Scanner pods on the same nodes without specifying Kubernetes resource limits and requests causes resource contention and makes Certifai scan times lengthy.
Pod scheduling to different nodes is managed by various controllers in Kubernetes. Taints, tolerations, and labels on nodes provide information to Kubernetes controllers to prevent resource contention.
Dedicated Nodes
While Kubernetes doesn’t natively have a concept of “dedicated” nodes, using taints and labels on the nodes combined with toleration on the workloads can ensure that each workload type gets scheduled on its own pool of dedicated nodes.
Refer to the following diagram:
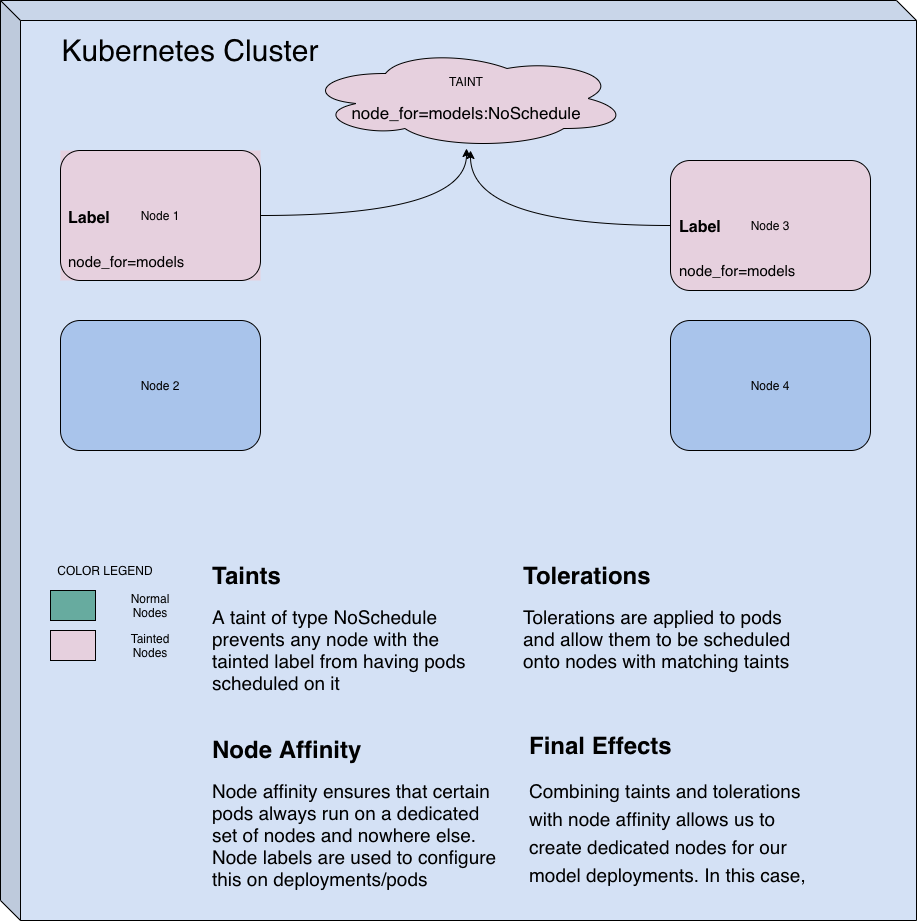
In the figure above, Nodes 1 and 2 are highlighted in pink because we configured them with the following attributes:
- Tainted with
node_for=models:NoSchedule - Labelled with key
node_forand valuemodels
The taint prevents pods from being scheduled on that node unless they have a matching toleration.
The label is used later on the pod definition to setup node affinity which ensures that pods belonging to a certain workload, in our case, the ML Model web service, only get scheduled on the nodes with a specified label.
The combination of these two changes helps reserve nodes 1 and 2 for the ML model web service pods.
Next, a skeleton templates is used to deploy a generic ML model in a Kubernetes cluster, which highlights the specific lines necessary to ensure they get scheduled on the dedicated nodes, 1 and 2.
A Sample Deployment Template
The following snippet contains a sample deployment of the Certifai Reference models server, publicly available at GitHub - CognitiveScale/certifai-reference-models: Reference Models for CognitiveScale’s Cortex Certifai.
---apiVersion: v1kind: ResourceQuotametadata: name: mem-cpu-demo namespace: refmodelsspec: hard: requests.memory: 35Gi---apiVersion: v1kind: Servicemetadata: labels: app: certifai-ref-models name: certifai-ref-models namespace: refmodelsspec: ports: - name: certifai-ref-models port: 5111 protocol: TCP targetPort: 5111 selector: app: certifai-ref-models sessionAffinity: None type: ClusterIPstatus: loadBalancer: {}---apiVersion: apps/v1kind: Deploymentmetadata: labels: app: certifai-ref-models name: certifai-ref-models namespace: refmodelsspec: progressDeadlineSeconds: 600 replicas: 10 revisionHistoryLimit: 10 selector: matchLabels: app: certifai-ref-models strategy: rollingUpdate: maxSurge: 25% maxUnavailable: 25% type: RollingUpdate template: metadata: labels: app: certifai-ref-models name: certifai-ref-models namespace: certifai spec: containers: - image: c12e/cortex-certifai-reference-model-server:1.3.3-15-g0f7d2ff imagePullPolicy: Always name: certifai-ref-models ports: - containerPort: 5111 protocol: TCP resources: requests: memory: "3Gi" cpu: "3000m" terminationMessagePath: /dev/termination-log terminationMessagePolicy: File affinity: nodeAffinity: requiredDuringSchedulingIgnoredDuringExecution: nodeSelectorTerms: - matchExpressions: - key: node_for operator: In values: - models tolerations: - key: "node_for" operator: "Equal" value: "models" effect: "NoSchedule" dnsPolicy: ClusterFirst restartPolicy: Always schedulerName: default-scheduler securityContext: {} terminationGracePeriodSeconds: 30The sections of interest in the snippet above are in spec.template.spec.affinity and spec.template.spec.tolerations.
spec.template.spec.affinityspecifies a node affinity for all nodes that have have a key value pair ofnode_for:models.spec.template.spec.tolerationsallow pods corresponding to this deployment to be scheduled on all nodes with the taintnode_for=models:NoSchedule.spec.containers[0].image.resources.requestscontains the amount of CPU and memory requested by this pod. The K8S scheduler ensures that this pod only gets scheduled on to nodes that have at least the requested amount of CPU/memory resources freely available.
Monitor Usage
The sample deployment template provided above also specifies resource requests for CPU and memory. The values provided in the template are specific to the Certifai Reference Model Server on a particular node configuration. We recommend you follow the steps in this section to gauge the baseline resource usage of your ML model web service.
Prerequisites
- A Kubernetes server with metrics-service installed and configured, plus an add-on that allows you to monitor deployed workloads for CPU and memory usage
- A deployed ML model web service on your Kubernetes cluster
- A load testing tool like
hey- GitHub - rakyll/hey: HTTP load generator, ApacheBench (ab) replacement, formerly known as rakyll/boom - A sample file containing about 3000 rows that can be used to invoke the ML model web service to get inferences. The data contained in this file needs to correspond to the format described in Predict API Reference | Cortex Certifai
- An ML model web service deployment template that starts off with reasonable average values for
spec.template.spec.containers[0].resources.requests. (These values need to be less than the available free resources on each node.)
Process
Evaluating Model Scaling performance
Using a load balancing tool like hey and the sample inference payload file mentioned in pre-requisites, run some load tests on the ML model web service while monitoring the resource usage on the different nodes.
Using a load balancing tool like hey and the sample inference payload file, run load tests on the ML model web service while monitoring the resource usage on the different nodes.
If you have 4 nodes and each node has 32 CPUs, 64GB RAM. You should set the resource requests of your ML web service deployment to a reasonable proportion of the available free resources on your server, while accounting for your other workloads.
Ideally, dedicate a node or two to run your ML model pods, so that they can take up all the CPU available and respond to inference requests as quickly as possible.
Run through several iterations of this load test while varying the following quantities:
- Resource requests for the ML web service deployment
- Resource limits for the ML web service deployment
- Replicas for the ML web service deployment
Vary these settings until you find the optimal requests/sec or throughput.
During this exercise, you can identify cases of resource contention for CPU (most of the time) or memory (very rare) by monitoring the cluster using K9s or similar tools.
After you have optimized the throughput, set the resource requests of the ML web service deployment to quantities close to the maximum resource usage observed in the best throughput case.
Consider this load testing scenario: You have run a few load tests while monitoring the resources being consumed by the model pods. Consider a table like below:
| Model Scaling | Req/sec | Peak CPU usage (deployment) | Peak Mem Usage (deployment) |
|---|---|---|---|
| 2 | 30 | 300% | 400MiB |
| 4 | 55 | 700% | 800 MiB |
| 6 | 35 | 1000% | 1GiB |
It's clear from the table above that scaling the model past 4 replicas no longer provides a corresponding increase in request throughput. This is a clear indication of resource contention happening amongst your model pods in each node, and requires a re-evaluation of the resource requests allocated to each individual model pod. In this case, the strategy to reduce resource contention among the model pods is to ensure each model pod has enough CPU + Memory reserved through resource requests. Therefore, increasing resource requests for each model pod will give you better performance.
Know the available CPU + Memory resources on each node while setting the resource requests for individual pods as well.
Evaluating Scanner scaling performance
Certifai Enterprise has the ability to parallelize scanning across multiple report types into multiple jobs with a configured concurrency level. In the previous sections of this guide, we learnt how to reserve nodes in a Kubernetes cluster for machine learning model inference workloads, and how to change / estimate each model pod's resource requirements to avoid resource contention between two pods on the same node.
In this section, we'll focus on evaluating the performance of the Certifai Scanner pods - These scanner pods are created each time you run a remote scan on Certifai. The certifai remote scan command allows you to specify the amount of CPU and memory each Scanner pod requests when a scan is triggered. The goal of this exercise is to ensure that the values provided are low enough to not constrict the Certifai Scanner and not too high so as to cause over-allocation of resources to each individual pod. Let's consider the following scenario:
You have a cluster with 6 nodes, out of which 3 have been dedicated for ML model pods as described in the previous sections and the other 3 are available for usage by the Certifai Scanner. Assume that each node has about 16GB RAM and 4 CPU cores
| Scanner Concurrency | CPU REQ | MEM REQ | Pods / Node (assuming only Certifai is on the cluster) |
|---|---|---|---|
| 4 | 2 | 2GiB | 2 |
| 4 | 3 | 2GiB | 1 |
| 4 | 2 | 3GiB | 2 |
| 4 | 0.5 | 500MiB | 4 |
The table above shows a few configurations with which you can trigger a remote scan. We recommend the following process to determine optimal resource request settings for the Scanner pods
- Create a remote scan with concurrency 1 and CPU/MEM requests set to some reasonable value
- Monitor the resource usage of the single Scanner pod over it's life and compute the peak CPU and Memory usage
- If the numbers found in Step 2, for example, are
3.5 CPUand1.3GiB, you should use these values for the--cpu-reqand--mem-reqparameters incertifai remote scan ... - Ensure the values you are passing to
certifai remote scan ...take into account the resources available on each node - Pick a concurrency value for the scan and also pass it to
certifai remote scan ...using the--parallelargument - Run a new remote scan with the determined
cpu-req,mem-reqand-parallelarguments and monitor resource usage across each node