Data Statistics and Drift Monitoring
This page provides details about Data Statistics report configuration and output.
Data Statistics and Drift Monitoring capabilities can be accessed through this publicly available notebook.
The Data Statistics evaluation type is a tool to monitor changes in new datasets when compared to a reference dataset. Certifai's data_statistics evaluation type allows users to monitor data trends, analyze data characteristics, and detect the presence of both feature drift and prediction label drift.
The output of this evaluation type is NOT calculated as part of the ATX score.
Scans that run Data Statistics evaluations offer report output in the publicly available notebook for Toolkit users and in the future will output to a Monitoring Dashboard for Enterprise users. Only the Toolkit version is currently available.
Evaluations
The generated report for Data Statistics evaluates several aspects related to the aggregation of monitored datasets:
- Data Quality: Counts of missing data (data not present in the monitored data) or counts of unexpected data (data not present in the reference data),
- Feature Quality: Quartiles for numeric features or distribution counts for categorical features
- Feature Drift: Univariate hypothesis testing to detect drift in individual features of the monitored data
- Prediction Distribution: Prediction value quartiles for regression tasks or label distribution counts for classification tasks
- Prediction Drift: Univariate hypothesis testing to detect drift in the prediction label
Setup
This type of report is meant to evaluate the monitored datasets behavior over a period of time. To facilitate this paradigm curate, label, and load datasets chronologically.
Configure use case and scans for data statistics as you would for other report types. No model access and model access scan types may be configured this type of report
Select scan evaluation type:
data_statisticsData Statistics reports typically monitor a specific set of data features that you specify as
monitored-features. You can supply features as a comma delimited list.If no list is provided and a model is given, a list of top N (default 50) monitored features will be calculated based on feature importance learned from the model.
Scans are run periodically and compared against a reference dataset to generate the reports described below.
Data Statistics Reports
Data Quality
Data constantly changes, and it is important to keep track of values as they appear or disappear. The data quality of the incoming monitored datasets is tracked for the following statistics:
missing_value: instances of missing values (i.e. NaNs) in the monitored dataset, either in the entire dataset (cells) or by data observation (rows)unexpected: instances where the monitored dataset contains feature values that do not exist in the entire reference dataset (cells) or by data observation (rows)
Example Data Quality visualizations
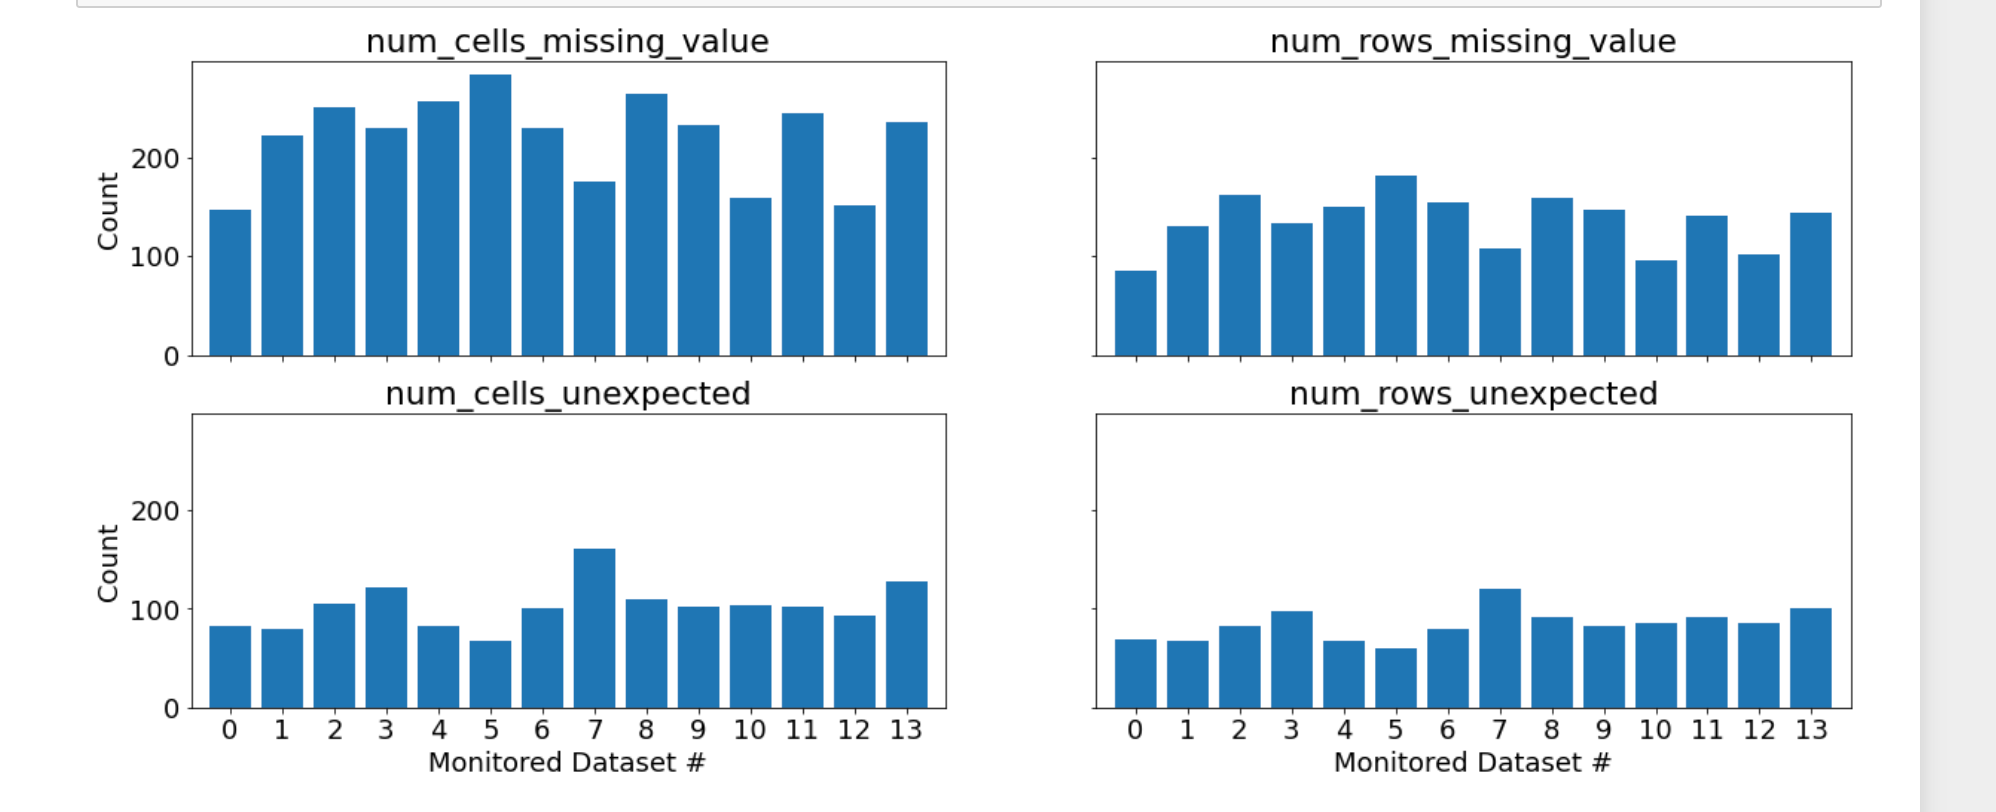
The monitored datasets in the example exhibit some cells (as well as rows and columns) where data is missing (i.e. NaN) as shown in num_cells_missing_value and num_rows_missing_value.
In addition values in the monitored data are not present in the reference set, which is depicted in num_cells_unexpected and num_rows_unexpected.
Feature Quality
The feature quality of the monitored datasets tracks the following distribution statistics:
- Quartiles (min, 25%, 50%, 75%, and max): for numeric features
- Data counts: for categorical features
These statistics allow you to monitor the distribution changes in a given feature across uploads of the monitored datasets.
There are various ways to investigate the categorical features of the monitored sets as depicted in the examples below.
Example Numeric Feature Quality visualizations
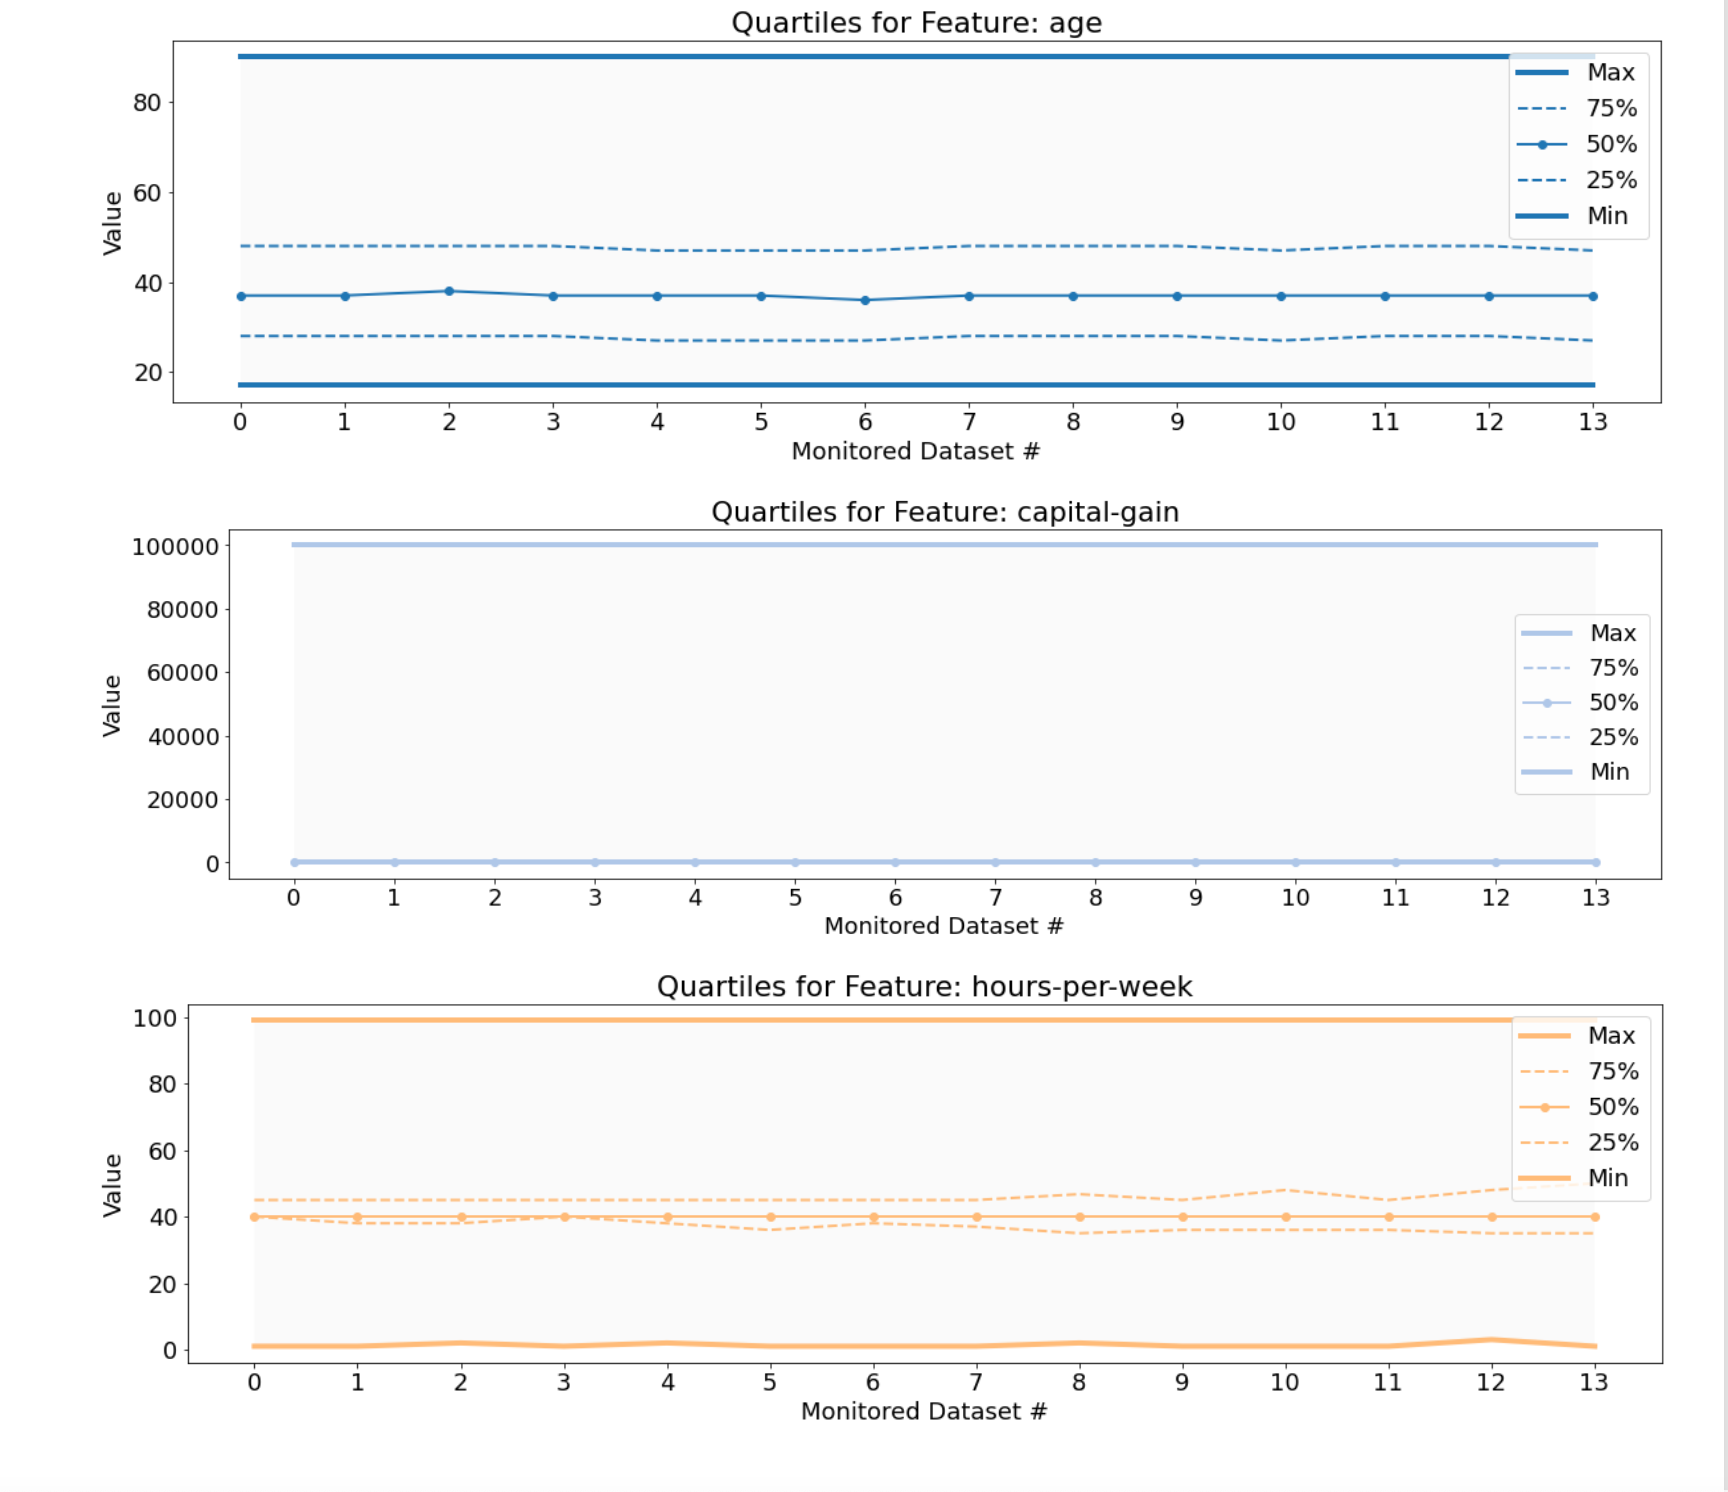
The quartiles are plotted over all datasets for the monitored numeric features.
Example Categorical Feature Quality visualizations (all features, one dataset)
The first example visualizes the count distributions of all the categorical features in one particular dataset.
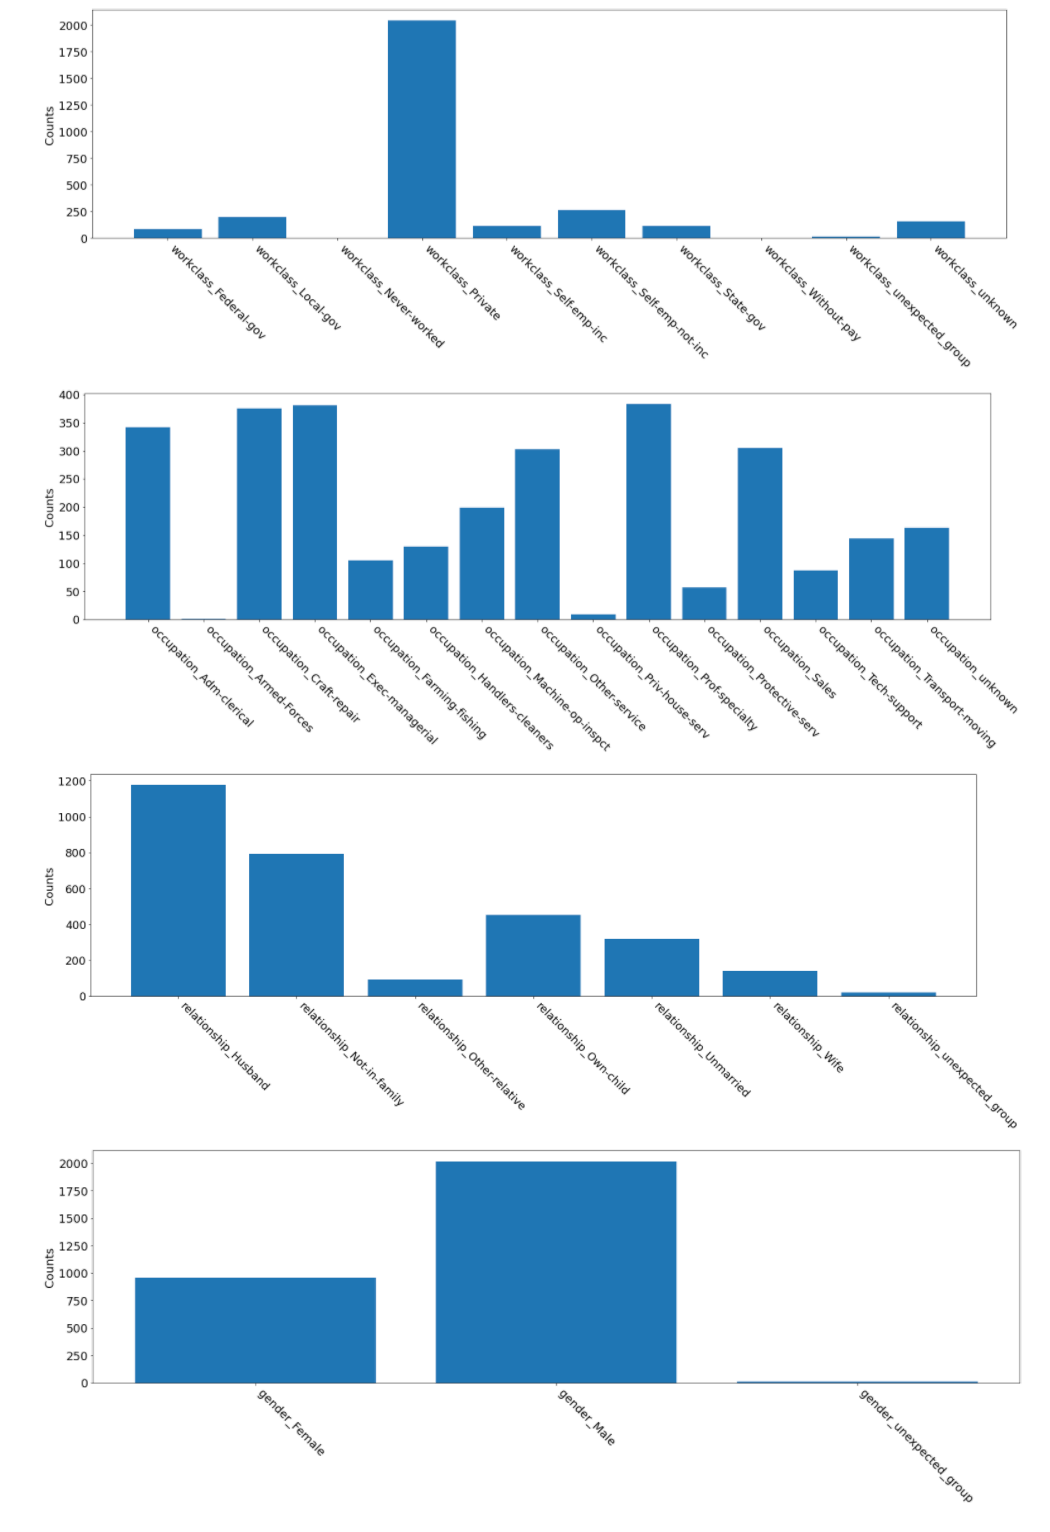
This visualization can help you see how the categorical data is distributed across the category values.
Example Categorical Feature Quality visualizations (any feature, all datasets)
The second example investigates the data distribution over all datasets for any of the features (e.g. workclass).
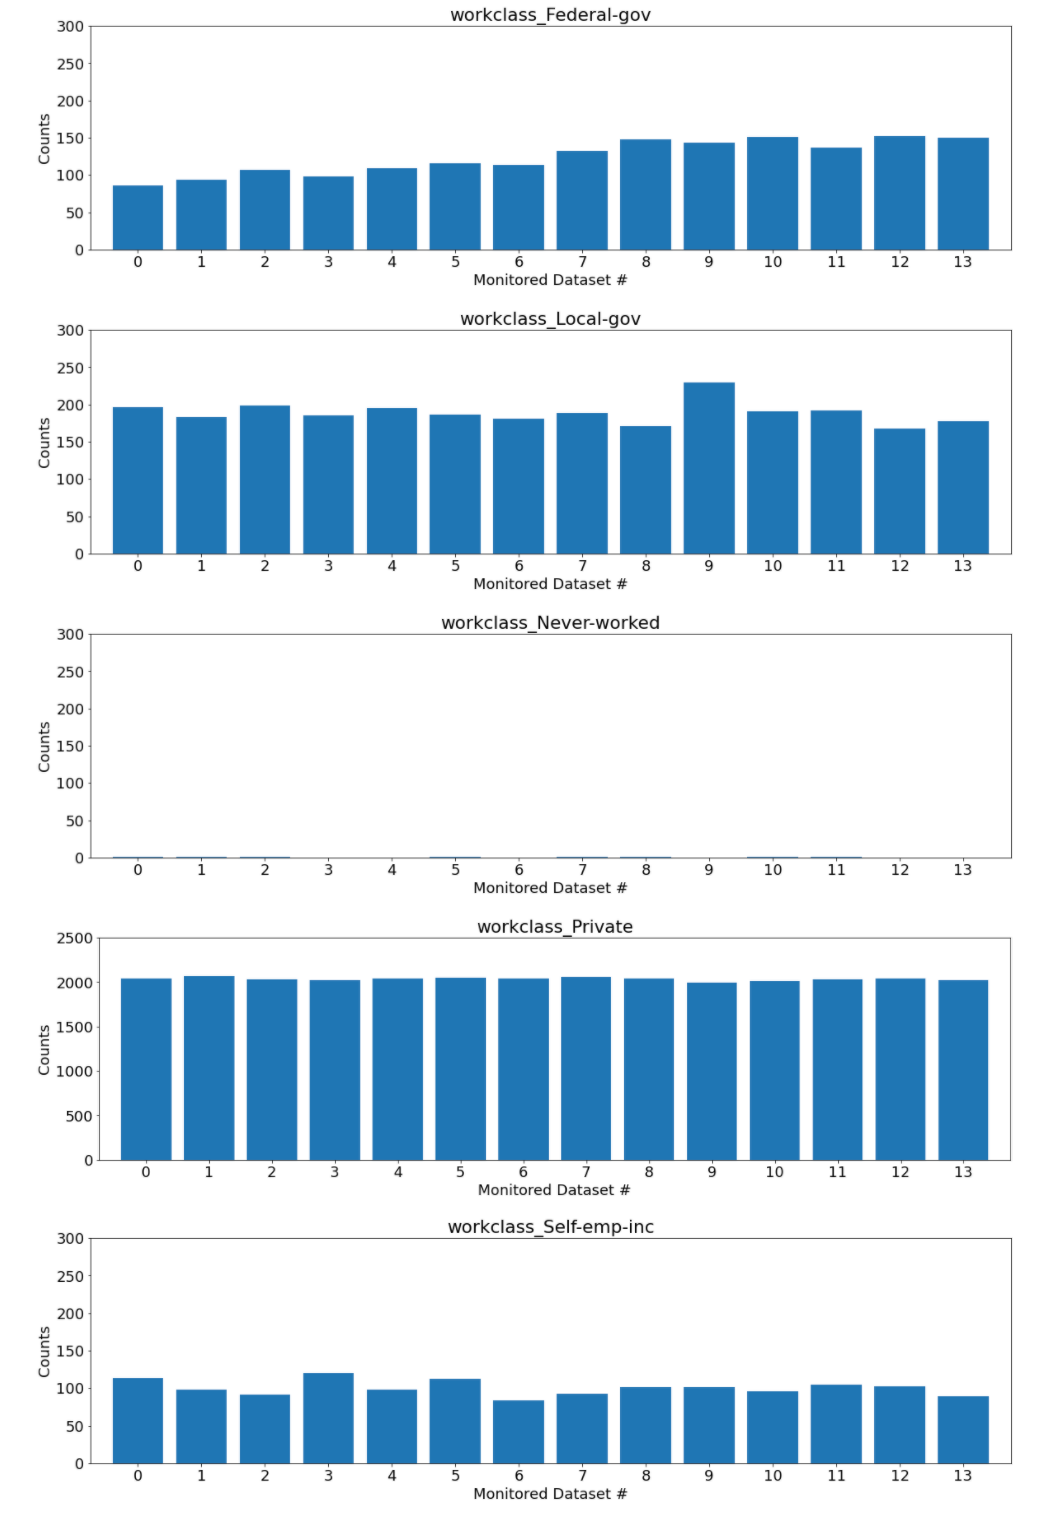
Over time (i.e. over monitored datasets), an increasing number of instances of the Federal-gov categorical value occur. All the other possible values hold steady or decrease.
Example Compare percent breakdown trend per categorical feature over monitored datasets
The data distribution by percentage for each feature over the monitored datasets is visualized in the third example.
The top 5 values in each categorical feature (determined by highest account in the reference dataset) are depicted and all the other values are grouped together.
Note that Certifai only returns count values if a categorical feature has 15 or fewer values - this helps avoid listing high cardinality features. As a result, categorical features with high cardinality cannot be displayed in this way.
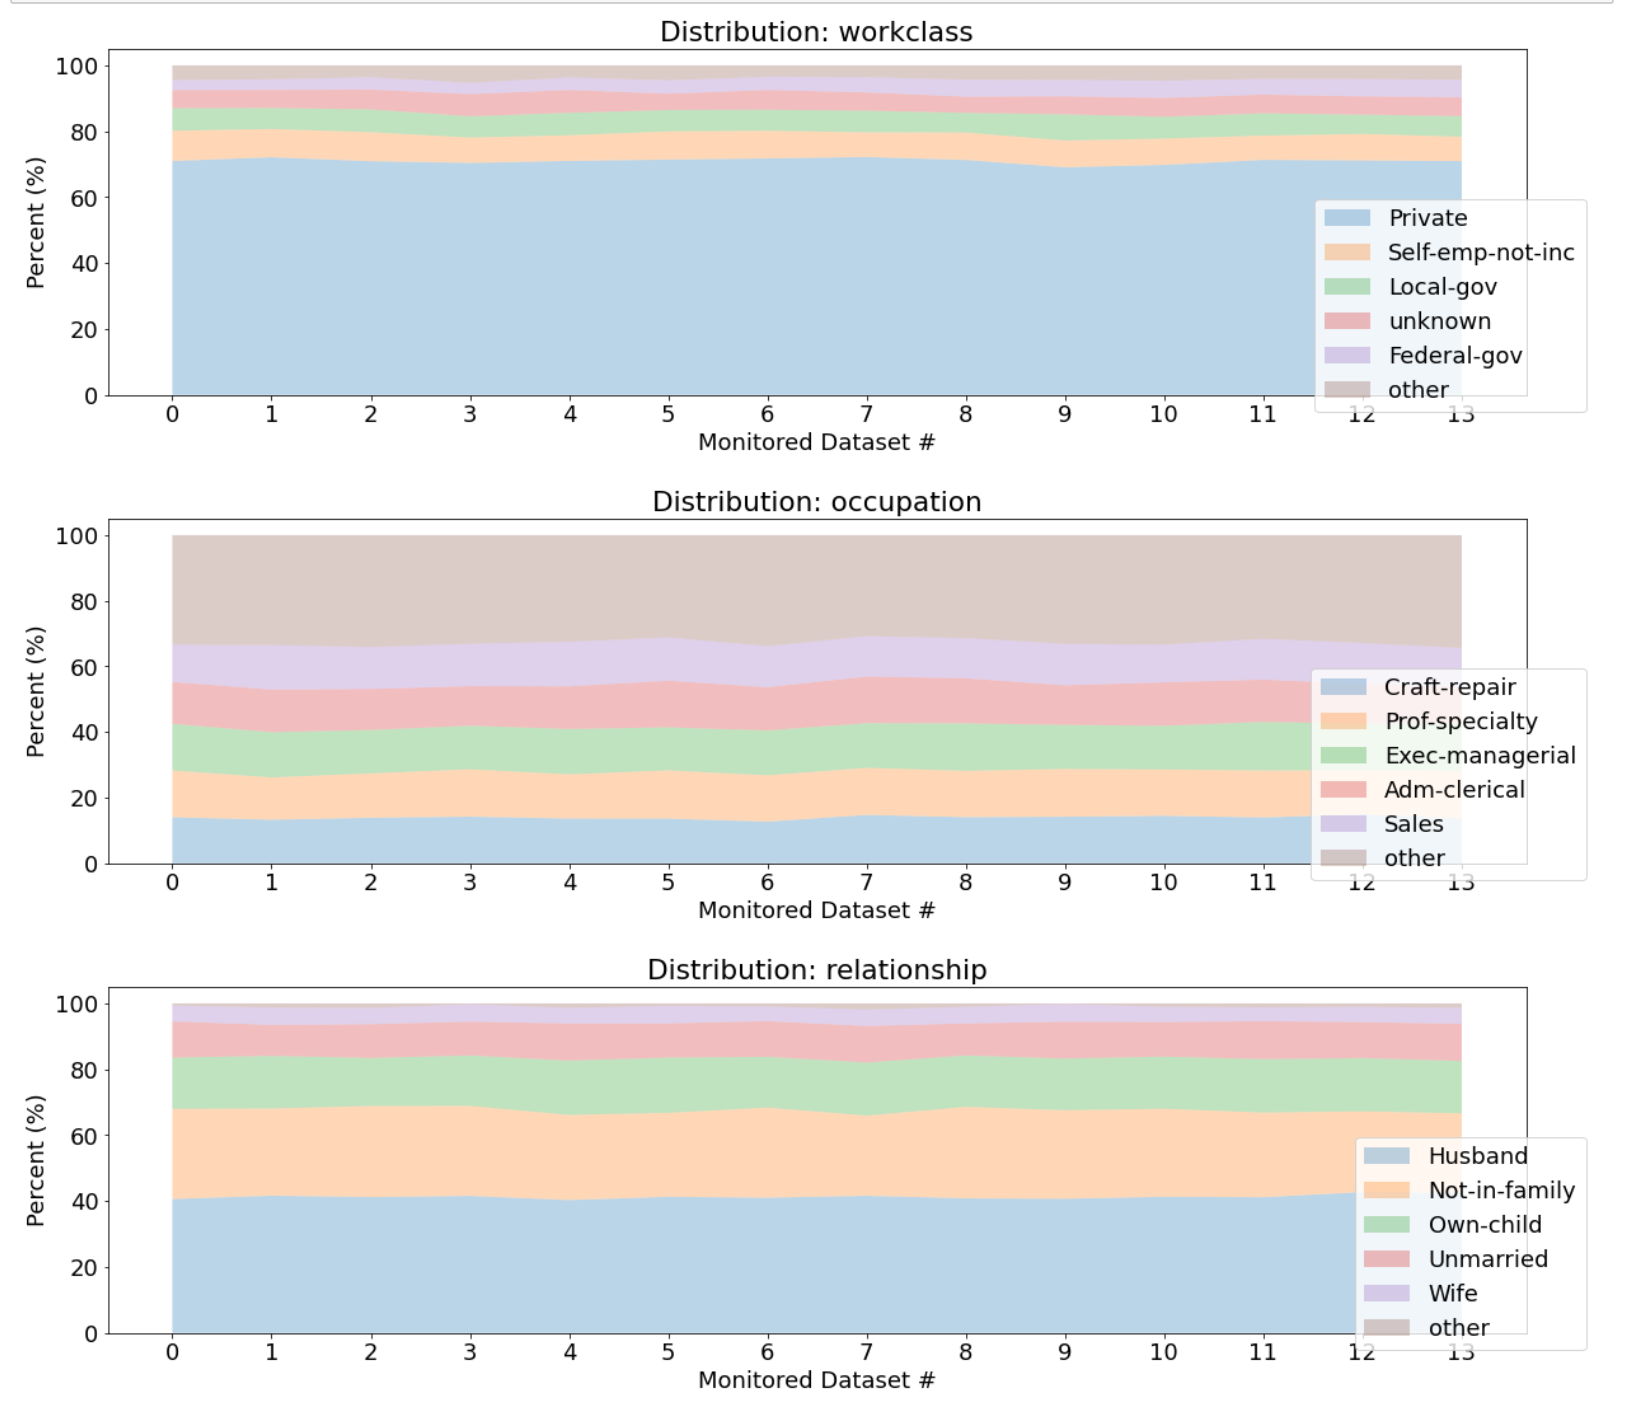
The above feature distribution plots allow a user to quickly visualize trends across their data and gauge whether intervention is needed to retrain models or to investigate recent data uploads.
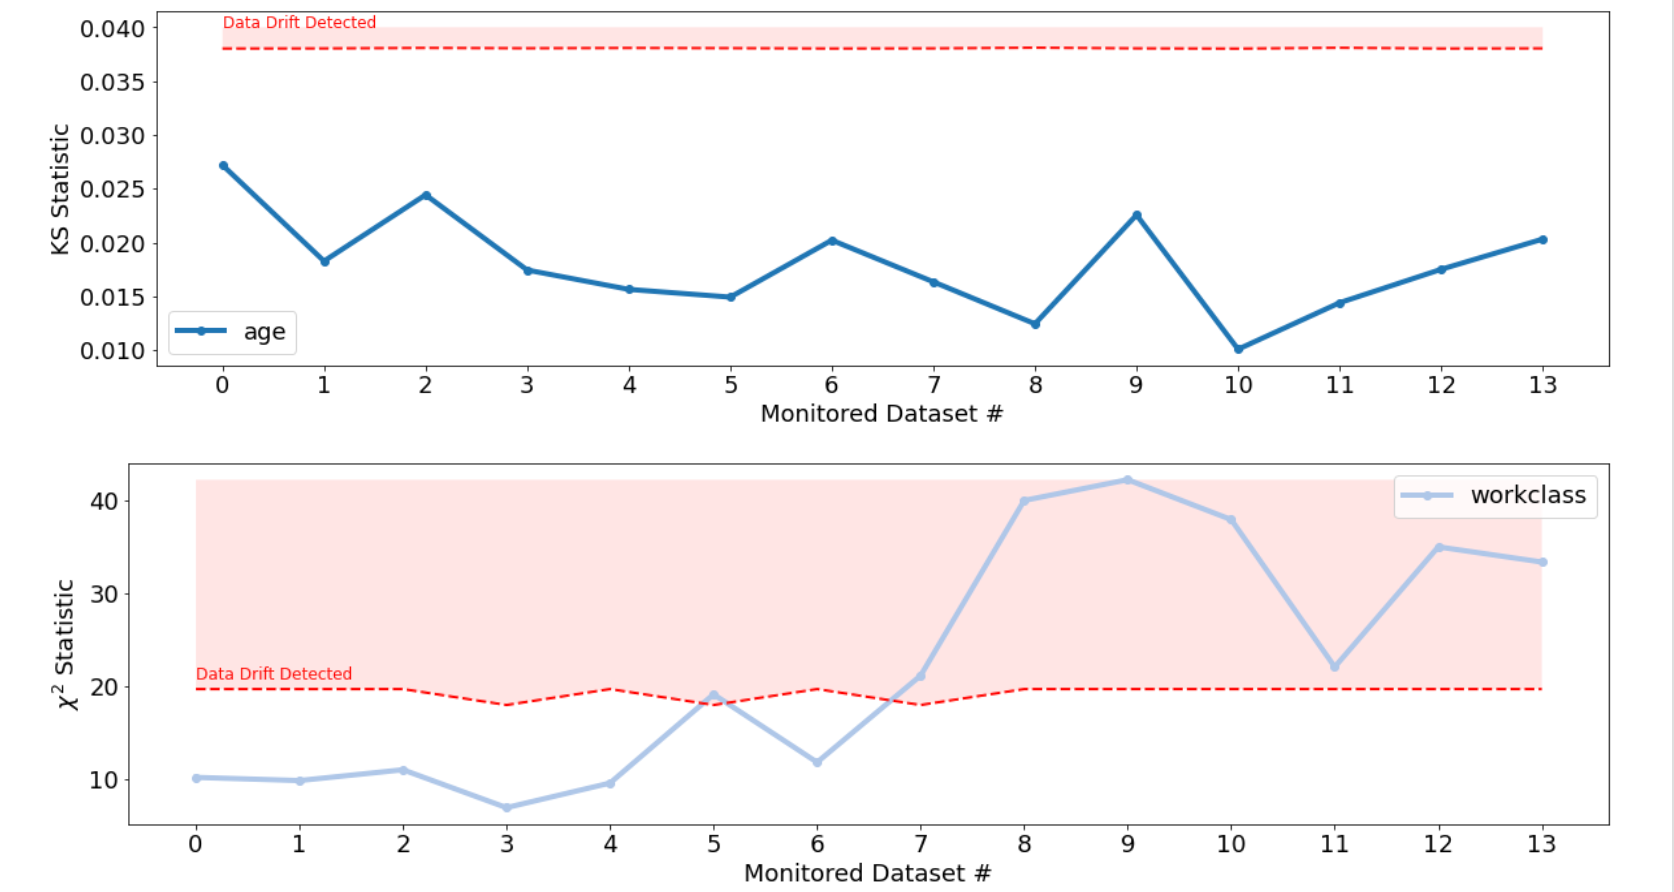
Feature Drift
Data drift detection uses univariate hypothesis testing. Depending on the type of the feature (i.e. numeric or categorical) or the type of learning task (i.e. regression or classification), different tests are employed:
- Kolmogorov-Smirnov Statistic for Numeric Drift Detection: a nonparametric evaluation of the similarity of two distributions through the cumulative empirical density function
- 𝜒2 Statistic for Categorical Drift Detection: a hypothesis test used primarily for count data
The presence of drift in any of the features of the monitored datasets may be detected. Each feature in the monitored datasets is compared to the same feature in the reference dataset.
The drift results from each of the scan reports is aggregated, so the appropriate drift statistic (KS or CS depending on the data type) for each of the features as a function of the time of the dataset upload can be tracked.
In addition to the drift statistics, the threshold value that signifies whether the drift metric is statistically significant is displayed.
Any crossing of the drift statistic above the threshold value indicates possible data drift.
Note that each dataset can have a unique crossing or non-crossing. If a dataset exhibits a statistically significant drift, you can focus your attention on how to resolve the drift: retrain the model or investigate the data in question.
Example Feature Drift report
Prediction Distribution
The trend in the distribution of the prediction labels of the monitored datasets can also be assessed to determine if drift from the reference predictions has occurred.
Label drift for classification tasks is determined using a chi-squared hypothesis test (i.e. treated as categorical).
Drift for regression tasks is determined using a Kolmogorov-Smirnov hypothesis test (i.e. treated as numeric).
Example Prediction Distribution report
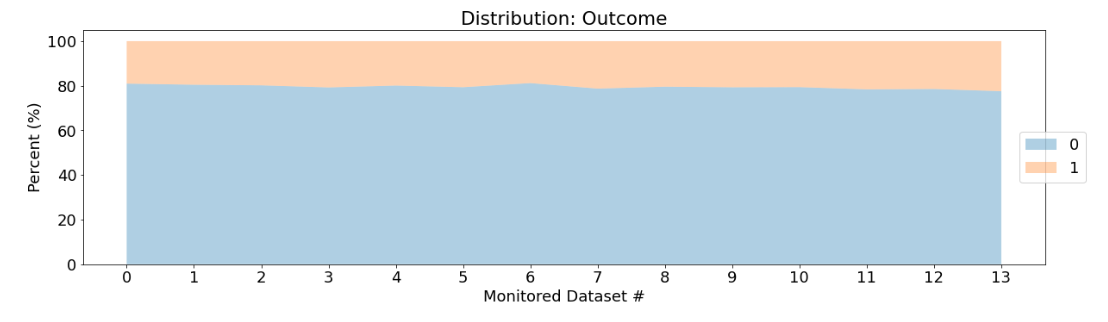
Over the course of the monitored sets the percentage of label 1 increases.
Prediction Drift
Example Prediction Drift report
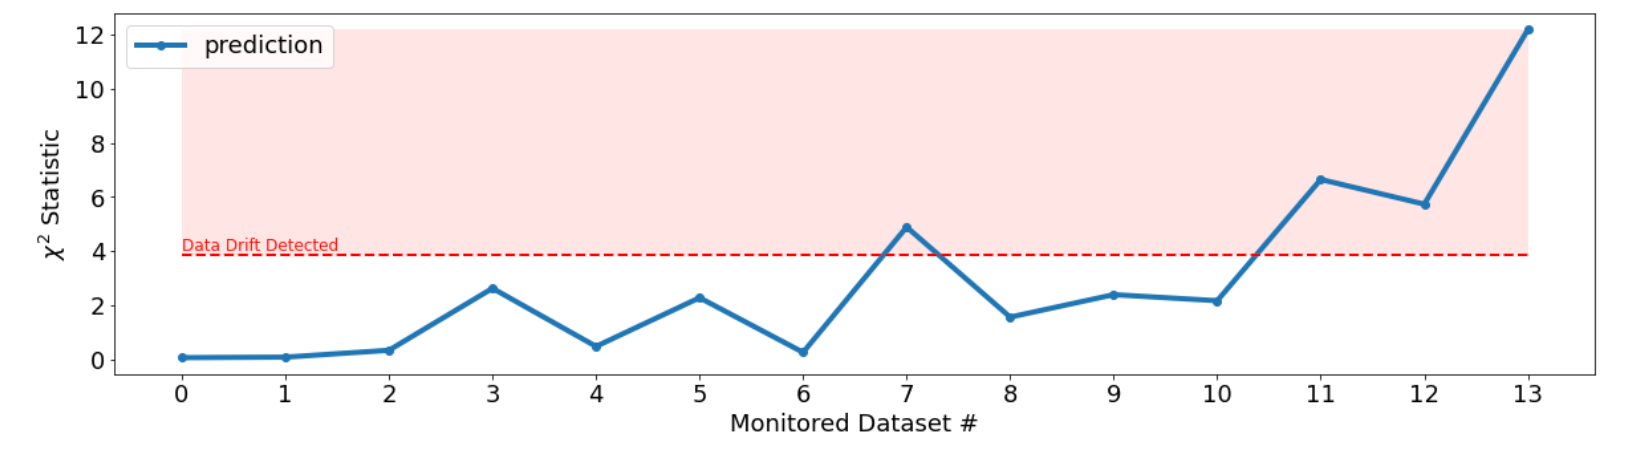
The drift in the labels becomes statistically significant for a few of the datasets (i.e. crossing the threshold).
Even though the amount of drift increases over time, the drift is introduced in a stochastic fashion, independently for each dataset. Therefore, while monitored dataset 7 crosses the threshold, subsequently monitored datasets are not guaranteed to cross the drift threshold.