Fairness
This page provides details about the Fairness trust factor in Cortex Certifai. Certifai supports multiple measures of Fairness which are described on this page, including:
- Burden
- Demographic Parity
- Predictive Parity (Sufficiency)
- Equalized Odds
- Equal Opportunity
Demographic Parity and Burden have the advantage of not requiring ground truth (labeled data), and they are not subject to bias that may have occurred in the labeling (e.g. historical bias).
Equal Opportunity, Equalized Odds, and Predictive Parity are useful when bias in ground truth is not a concern.
What is Fairness?
Fairness is a measure of the disparity between the change required to alter the outcome in categorical groups defined by the fairness grouping feature.
Fairness is a particular concern in AI systems because bias exhibited by predictive models can render models untrustworthy and unfair to one or more target groups.
For example, different models can exhibit any number of biases towards features like gender, age, or educational level.
Features targeted for fairness evaluation may be numeric (e.g. age) or non-numeric (e.g. marital status).
Fairness metrics are based on the prediction results depicted in the 'confusion matrix' (e.g. demographic parity) to determine if unfairness has occurred - regardless of whether the outcome is favorable or unfavorable and whether or not it was predicted correctly. These metrics require ground truth labels.
However, traditional fairness metrics fail to outline how one could overcome this inequality or analyze results in the absence of ground truth labels. To address these shortcomings, we devise a fairness metric in Certifai called Burden, which is based on the closest counterfactuals of data points. This allows a user to gain a perspective of how difficult it may be to obtain a favorable outcome since the counterfactual exists on the decision boundary.
Example: In the use case of binary classification models that are predicting if a loan applicant will be granted or denied a loan, Certifai users might want to decide which model shows a higher level of fairness between male, female, and self-assigning applicants. In this case, the user would run a scan choosing "gender" as one of the fairness grouping features. The report generated by Scan Manager would assign results as "favorable" for applicants granted a loan and "unfavorable" for applicants denied a loan.
Fairness reports may be selected as one of the output types in Certifai Scan Manager.
Fairness Metrics
What is Equalized Odds?
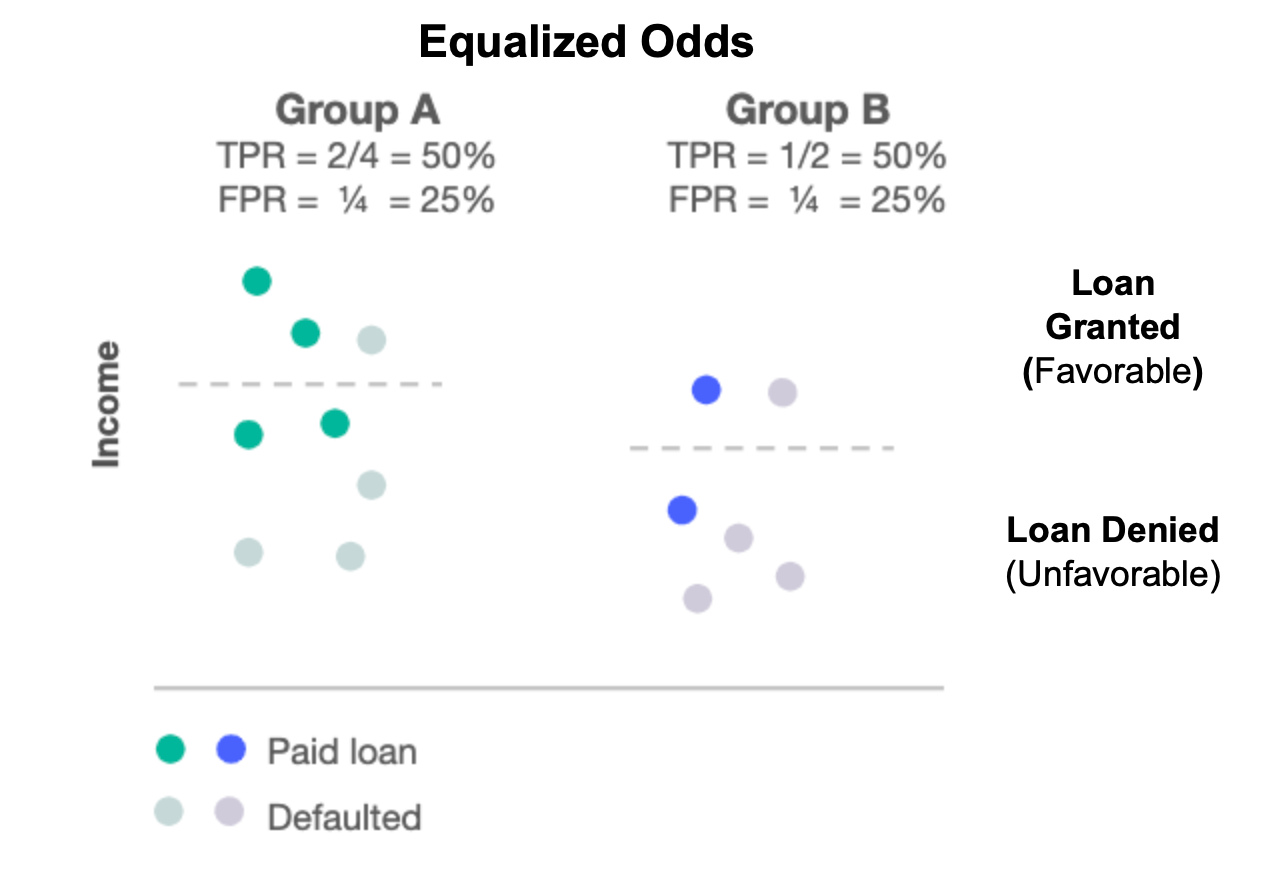
The Equalized Odds fairness metric is based on the 'confusion matrix'. Thus, the metric depends on the predicted outcome of the model and the ground truth labels.
Equalized odds ensures that the probability of a positive prediction is the same for both favorable and unfavorable truth labels across all groups of a feature. In other words, the model's true positive rates and false positive rates are the same across groups.
Equal Odds is useful when positive predictions are important and false positives are a concern (e.g. granting a loan).
For example: Equalized Odds states that the favorable outcome (being granted a loan) occurs at roughly the same percent of the time for all protected groups (males and females) (AND correspondingly the unfavorable outcome occurs at roughly the same percent of the time).
Example: Equalized Odds based on income and using payment history
What is Equal Opportunity?
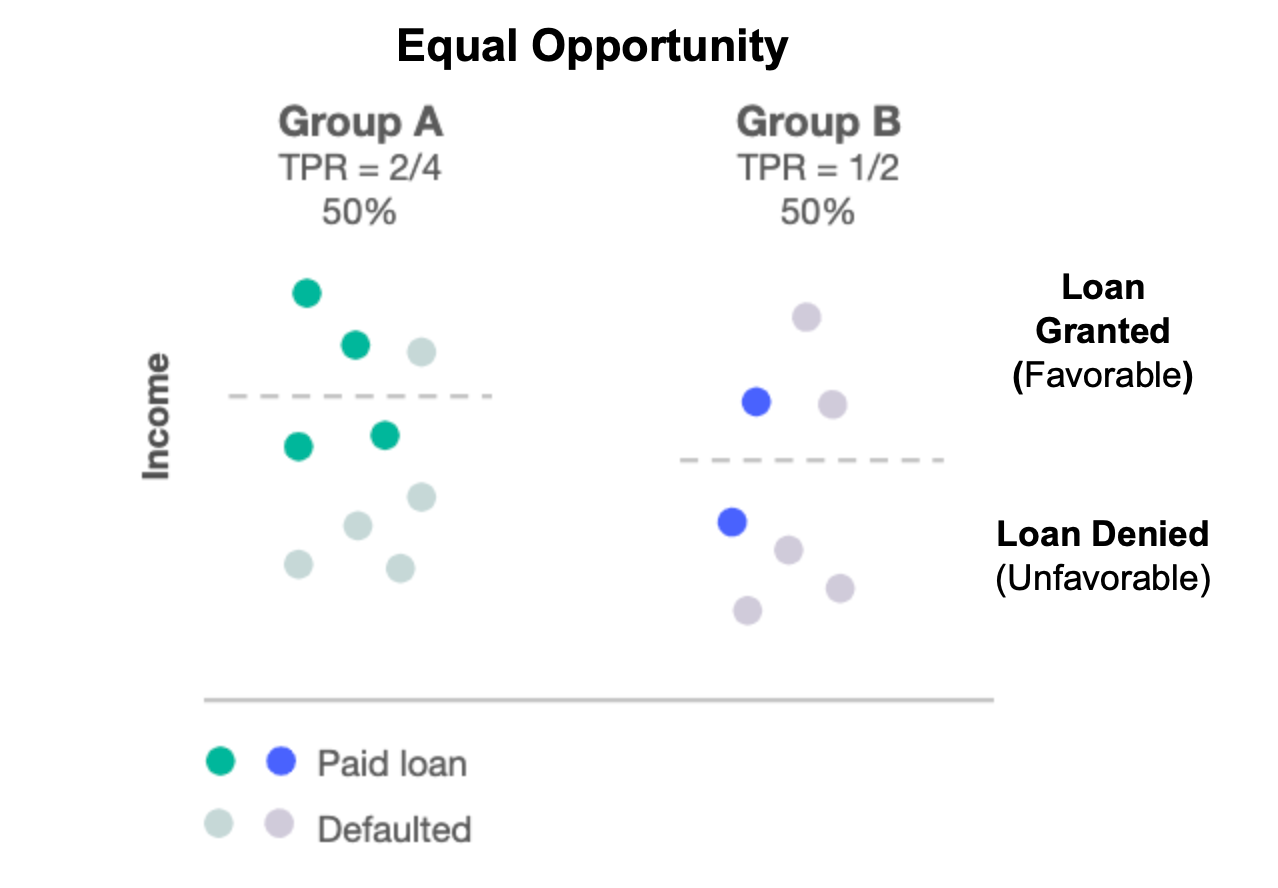
Equal Opportunity is also based on the 'confusion matrix'. Thus, the metric depends on the predicted outcome of the model and the ground truth labels.
Equal Opportunity fairness metric verifies that odds of obtaining a favorable result are equal for a single protected group across a specified attribute's values.
Equal opportunity is useful when positive predictions are important, as long as false positives are not a concern (e.g. detecting fraudulent transactions).
Equal opportunity ensures that if 80% of qualified males get the favorable outcome, a similar percentage of females do. Where "qualified" means "favorable ground truth".
Example B: Equal Opportunity based on income and using payment history
What is Demographic Parity?
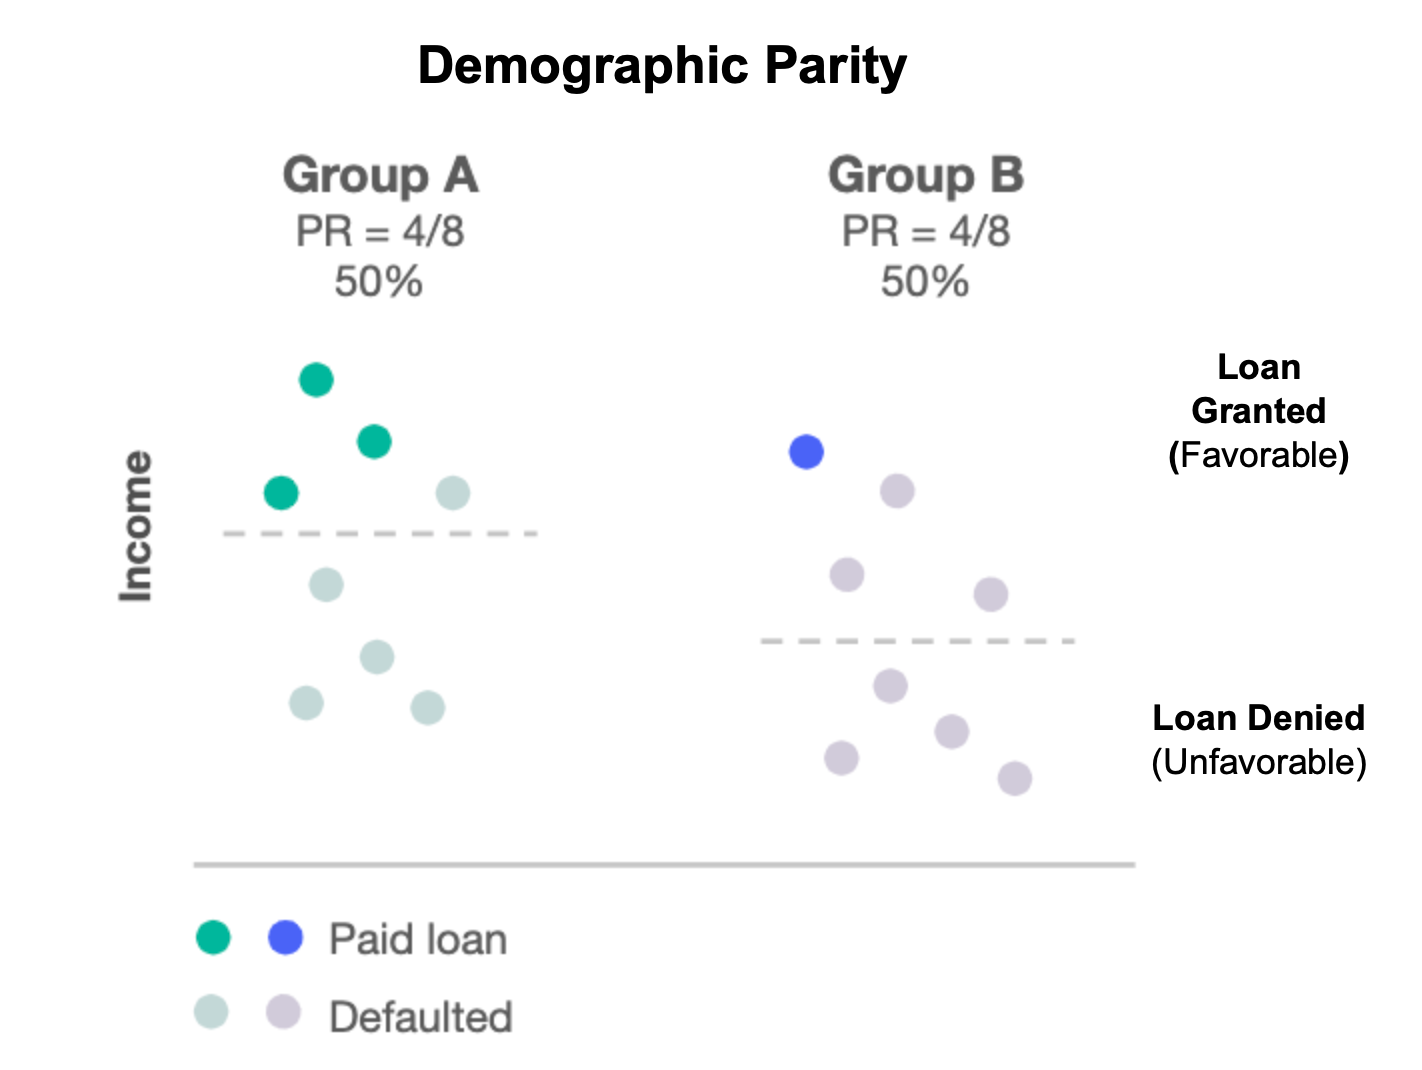
Demographic Parity ensures that the proportion of individuals in each protected group (e.g. male/female) of a protected feature (e.g. gender) receives a positive outcome at equal rates. (e.g. both men and women receive auto loans 40% of the time across all zip codes).
Demographic parity is often used where regulations require the minimization of disparate impact.
Example: Demographic based on income and using payment history
What is Predictive Parity (Sufficiency)?
Predictive Parity (or Sufficiency) is based on the 'confusion matrix'. Thus, the metric depends on the predicted outcome of the model and the ground truth labels.
Predictive Parity verifies that the precision rates for protected groups are (e.g. male/female) of a protected feature (e.g. gender) are roughly equivalent.
For example Predictive Parity ensures that the model predicting the rate of loans being granted is accurate across zip codes.
What is Burden?
Burden is a group-based metric from the perspective of the "unfavorable" outcome. burdens allows a user to gain a perspective of how difficult it may be to obtain a favorable outcome.
Burden can provide a more nuanced metric reflecting the distribution of predictions. It is also the only metric currently supported for regression use cases.
Burden represents a weighted proportion of individual groups in a protected feature who experience a negative outcome. This weight is determined by the average distance of a group to the outcome boundary between a favorable and unfavorable outcome (derived by counterfactuals). We can interpret this distance as the "burden" an individual must overcome to receive a favorable outcome.
Fairness Burden scores are derived by using counterfactuals to find the degree to which the values of an input data point must change to obtain a favorable prediction from the model.
The Burden is the average amount of change required for members of feature groups to achieve a favorable result (e.g. loan granted).
A lower number indicates that less change is required for that group to have a favorable outcome.
If the burden for one group is very high and the burden for another group is low, the model may be unfair to the group with the higher burden.
Ideally, the objective is to have burdens as close to one another as possible, which indicates the model is treating members within the selected groups fairly.
It is important to note that burden is not comparable across features. They are only designed to compare the groups within a single feature. (e.g you cannot compare fairness between age and marital status.)
Burden-based Fairness Concepts
Favorability Values for Classification
Favorability options give users alternative ways to define what outcomes are considered favorable.
- None: Changes are neither favorable nor unfavorable, therefore a change to any other outcome class is a counterfactual. (NOTE: Fairness cannot be calculated with favorability of NONE.)
- Explicit/Partitioned: Identifies a change to any class in the other partition is counterfactual; a favorable change is from the unfavorable partition to the favorable one
- Ordered: Outcome classes have an implicit ordering from most to least favorable. Any change in outcome class may be sufficient to be considered a counterfactual, but it is worth noting that the change is relative to the original value.
Defining a favorable outcome for Regression
Unlike Classification tasks where a favorable outcome corresponds with one or more outcome classes, defining a favorable outcome for a Regression task can depend on the distribution being predicted.
Certifai allows users to define a predicted outcome as being favorable for Regression tasks relative to starting point or via a fixed threshold.
For example, in a use case where Regression models are predicting the total insurance claim amount for an individual, let us assume that having receiving a higher claim amount is a more favorable result. An increase from $500 to $501 might not seem favorable when compared to a potential increase from $500 to $10,000. Alternatively, we might consider any claim amount above $5000 as favorable, and any claim below as unfavorable.
Relative change:
- A significant increase or decrease from the original prediction value is considered favorable.
- The amount of change that is considered significant is specified in terms of standard deviations for the predicted outcome.
Absolute change:
- Defines a threshold as a percentile or absolute value.
- Favorable outcomes are either strictly above or below the threshold.
Fairness calculations
How is Fairness Calculated?
Certifai aggregates the metrics for each group into a feature fairness score, where 100% is perfectly fair (no disparity). The overall fairness score is taken to be the minimum score for any fairness feature.
For assessment of disparate impact, it is common to assess the maximum disparity across the groups. Certifai uses maximum disparity for all of the metrics other than burden.
Certifai uses Gini to aggregate burden across the groups, giving an indication of the mean disparity.
How is Burden calculated?
Here are the brief steps for calculating fairness:
- Calculate burden for each group.
- Compute the Gini index for each feature group.
- Convert to a percentage that is (1 - GiniIndex).
If all feature group burdens are equal, you get a 100% fair system, and if only one group has non-zero burden but none of the others do, you get 0.
Example: In a binary classification problem where the positive class is the desired outcome:
- If the instance is classified as positive, there is 0 burden.
- If the instance is classified as negative, burden is a monotonic function, f() of the distance to the decision boundary, as this distance indicates how much work will need to be done (i.e. the burden) to flip to the desired outcome.
How are Parity and Equality Fairness Scores Calculated?
The Parity and Equality Fairness Feature score is based on the maximum discrepancy in the metric between fairness groupings.
For example, in demographic parity if 75% of men receive a positive outcome, and only 50% of women do, then the fairness score is Calculated as follows: 1-((0.75-0.5)/0.75) = 66.7%.
NOTE: The denominator is the largest outcome group, regardless of whether the outcome is positive or negative. If 25% of men and 20% of women obtained a favorable outcome, then 75% or men and 80% of women had unfavorable outcomes so the score would be calculated as follows: 1-((0.25-0.2)/0.8) = 93.75%
What Is the Importance of Fairness?
Based on fairness scores the following actions might be taken by the various Certifai users:
Data scientists might attempt to retrain any of the models with datasets that contain more equal distributions for age and status and compare the results again.
Business decision-makers might select the fairest model for production deployment of their loan application
Compliance officers might reject the use of models with overall scores or feature category differences that don’t meet a certain threshold for fairness since that is a critical aspect of trusted AI.
How is Fairness Displayed in Certifai?
The Fairness by Group visualizations are displayed in the Console:
- An overall view that shows a the average fairness score for each model.
- A model view that shows a histogram of the fairness scores for each grouping feature in the model.
At the top of the page, the favorable outcome for the scan is identified, (for example "Loan Granted" for the Banking:Loan Approval sample use case).
Each of the Fairness features that were defined for the scan is displayed in a separate graph. In the case of the Banking:Loan Approval use case the features are status and age.