 Cortex Charts
Logging
Logging with Cortex Fabric has been externalized and is no longer packaged with the Cortex Fabric Helm chart.
By default all pods log to their stdout/stderr streams within Kubernetes. It's possible to view these logs by using kubectl or k9s, but if additional logging is required, please follow the architecture outlined below.
The recommended approach is to install a Fluentd daemonset to gather logs/stdout from pods and forward them to an aggregation system of your choice. There are specialized helm charts for elasticsearch integration or a generic fluentd helm chart that can be configured/extended accordingly.
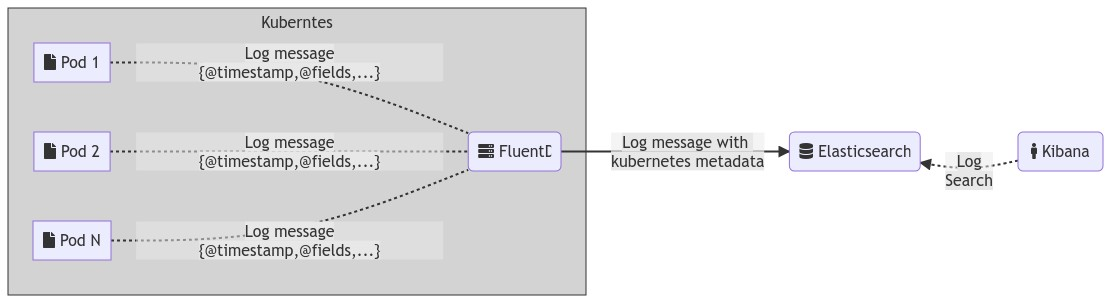
Logging Architecture
All Cortex services use Logstash (JSON) format for log messages (with the exception of the operator service).
Template for log message in Logstash format written from Cortex services
{ "@timestamp": "2022-09-19T11:46:44.168Z", "@fields" :{ "level": "ERROR", "label": "gateway", ..., ..., }, "@message" : "Error connecting to redis",}The recommended logging implementation for Cortex uses a combination of Elasticsearch, Fluentd, and Kibana (referred to as EFK from now on), which need to be installed separately.
Fluentd allows for extensive configuration to customize logging events emitted to include additional metadata for indexing/troubleshooting. By default the Fluentd-elasticsearch chart is configured to include Kubernetes metadata in log events.
Prerequisites
Ensure the following Helm repositories are configured for your local installation by running:
helm repo add stable https://kubernetes-charts.storage.googleapis.comhelm repo add kiwigrid https://kiwigrid.github.ioConfiguration
Each sub-chart has different sets/styles of configuration that they accept, please reference the individual chart repositories for instructions on how to configure each component:
Note: Due to the Helm Chart Library deprecation timeline, some alternatives to these charts will remain hosted and available here, although there might be slight differences in the configurations.
Example Configuration
The following are example values that can be used to install the logging components:
Fluentd-elasticsearch:
elasticsearch:# Enable the following block if authentication is enabled on elasticsearch# auth:# enabled: true# user: "elastic"# password: "changeme" bufferChunkLimit: "2M" bufferQueueLimit: 8 # update this host list accordingly hosts: ["elasticsearch-client.default.svc.cluster.local:9200"] logstashPrefix: "logstash" port: 9200 path: "" scheme: "http" sslVerify: false sslVersion: "TLSv1_2" outputType: "elasticsearch" typeName: "_doc" logLevel: "info"Elasticsearch (the following installs plugins into elasticsearch, if these are not relevant for your deployment, these can be safely omitted):
extraInitContainers: |- name: "plugin-install-ingest-attachment" image: "docker.elastic.co/elasticsearch/elasticsearch-oss:6.7.0" command: ["/bin/bash"] args: ["-c", "yes | /usr/share/elasticsearch/bin/elasticsearch-plugin install ingest-attachment"]- name: "plugin-install-mapper-size" image: "docker.elastic.co/elasticsearch/elasticsearch-oss:6.7.0" command: ["/bin/bash"] args: ["-c", "yes | /usr/share/elasticsearch/bin/elasticsearch-plugin install mapper-size"]Kibana:
files: kibana.yml: elasticsearch.url: http://elasticsearch-client.default.svc.cluster.local:9200Installation
Once you have specified any additional configuration for each chart component (preferably in a separate values.yaml file), install each of the chart components with
helm upgrade --install ${CHART_NAME} -f ${VALUES_FILE} -n ${NAMESPACE}Example: The following commands will install the logging components in the default namespace of your Kubernetes cluster:
helm upgrade --install elasticsearch stable/elasticsearch -f /tmp/elasticsearch.yaml --version 6.8.6helm upgrade --install kibana stable/kibana -f /tmp/kibana.yaml --version 6.7.0helm upgrade --install fluentd-elasticsearch kiwigrid/fluentd-elasticsearch -f /tmp/fluentd.yaml --version 3.0.2It is possible to install these component into a logging namespace or include them in the cortex namespace, just ensure any dependent configuration is updated (such as service URL's).
Log Format
Fluentd allows for extensive configuration to customize logging events emitted to include additional metadata for indexing/troubleshooting. By default the Fluentd-elasticsearch chart is configured to include Kubernetes metadata in log events.
Example of the FluentId output with pod level information (click to expand)
{ "_index": "logstash-2020.07.13", "_type": "_doc", "_id": "lJvYSXMBYBaZNK3bLpPl", "_version": 1, "_score": null, "_source": { "stream": "stdout", "docker": { "container_id": "f955c16bef855619a795b9053189f5b66d51cf21ed26bd1dd26ff83f6baf6a04" }, "kubernetes": { "container_name": "kibana", "namespace_name": "default", "pod_name": "kibana-65f58dc64c-spjjt", "container_image": "docker.elastic.co/kibana/kibana-oss:6.7.0", "container_image_id": "docker-pullable://docker.elastic.co/kibana/kibana-oss@sha256:9af7fbceb7c9a746df1f7dc79d2b3bb320f0fddf9b06a3cc12fd8f903902e731", "pod_id": "dfc2f222-e07d-434c-b9e1-35d4482960fe", "host": "minikube", "labels": { "app": "kibana", "pod-template-hash": "65f58dc64c", "release": "kibana" }, "master_url": "https://10.96.0.1:443/api", "namespace_id": "9e8e057e-4345-49fe-9b8f-260538d5c019" }, "type": "response", "@timestamp": "2020-07-13T20:22:49Z", "tags": [], "pid": 1, "method": "get", "statusCode": 200, "req": { "url": "/api/index_patterns/_fields_for_wildcard?pattern=log*&meta_fields=_source&meta_fields=_id&meta_fields=_type&meta_fields=_index&meta_fields=_score", "method": "get", "headers": { "host": "localhost:5601", "connection": "keep-alive", "accept": "application/json, text/plain, */*", "kbn-version": "6.7.0", "user-agent": "Mozilla/5.0 (Macintosh; Intel Mac OS X 10_15_5) AppleWebKit/537.36 (KHTML, like Gecko) Chrome/83.0.4103.116 Safari/537.36", "sec-fetch-site": "same-origin", "sec-fetch-mode": "cors", "sec-fetch-dest": "empty", "referer": "http://localhost:5601/app/kibana", "accept-encoding": "gzip, deflate, br", "accept-language": "en-US,en;q=0.9" }, "remoteAddress": "127.0.0.1", "userAgent": "127.0.0.1", "referer": "http://localhost:5601/app/kibana" }, "res": { "statusCode": 200, "responseTime": 26, "contentLength": 9 }, "message": "GET /api/index_patterns/_fields_for_wildcard?pattern=log*&meta_fields=_source&meta_fields=_id&meta_fields=_type&meta_fields=_index&meta_fields=_score 200 26ms - 9.0B", "tag": "kubernetes.var.log.containers.kibana-65f58dc64c-spjjt_default_kibana-f955c16bef855619a795b9053189f5b66d51cf21ed26bd1dd26ff83f6baf6a04.log" }, "fields": { "@timestamp": [ "2020-07-13T20:22:49.000Z" ], "timestamp": [] }, "sort": [ 1594671769000 ]}Viewing Logs
We recommend that you enable Kibana Ingress for your installation, so that users can externally access the Kibana dashboard for viewing logs.
Alternatively, users can access the logs dashboard locally by setting up a port-forwarding rule with kubectl to access the service in Kubernetes over localhost:
kubectl port-forward $(kubectl get pods --selector=app=kibana -n ${NAMESPACE} --output=jsonpath="{.items..metadata.name}") -n ${NAMESPACE} 5601You should now be able to access the Kibana dashboard by opening a browser to http://localhost:5601.