Run Mission Simulations
This page provides instructions and best practices for running and reviewing Mission simulations for Campaigns.
Prerequisites
Before continuing be sure that you have completed the activities on the following pages:
SAMPLE SIZE RECOMMENDATION: To run a sample size and iterations of 1000 each a cluster should have 2 nodes of 32GB RAM minimum.
Mission lifecycle
Following configuration, a mission follows a set lifecycle. You can move a mission through these stages from the Workflow panel that is available whether you have the Mission Control or Interventions tab selected. This panel can be opened and closed using the < and > icons. Each stage of the lifecycle is associated with a set of actions (in caps below) and status details as follows:
- Editing Stage: Edit interventions. Interventions can only be edited in this stage.
- SIMULATE: Initiates a simulation run.
- Simulating Stage: Runs the mission simulation.
- DEFINE: Simulation values are set.
- RUN: Simulation runs and the visualization is displayed.
- STOP: Stops the simulation run without completing it
- REFINE: Takes you to the next phase of the Mission lifecycle when the simulation is completed
- EDIT: Returns you to the Edit phase of the Mission Lifecycle to continue work on Interventions
- Simulation ID: An identifier for the simulation run
- Status: The status of the simulation run (Active, Completed, or Error)
- Refining Stage: Simulation results are reviewed by domain experts and the model is refined
- DEFINE PLAN VALUES: Select the values for Plan examination.
- REFINE PLANS: View simulation results and reorder or remove plans.
- DONE: Moves you to the pre-deployment configuration and check
- RE-SIM: Run a new simulation based on the review and model refinement resulting from that review
- EDIT: Returns you to the Edit phase of the Mission Lifecycle to continue work on Interventions
- Deployable Stage: Marks the Mission as ready for deployment. Actions must be configured to initiate this stage. A Campaign can be deployed when all missions are in this stage.
- Deployed Stage: Indicates that the Mission has been deployed and is ready to invoke.
Simulation States
- Unknown: When the simulation starts this state may displayed as the job is queued. In general this state indicates that a status is not available or it has been lost.
- Running: When the Simulation job has been started but has not yet completed nor been cancelled, this is the state displayed.
- Cancelled: When a user stops the Simulation by clicking the STOP button, this is the state displayed. ("Simulation cancelled by user" is shown in the Workflow panel at the bottom right.)
- Completed: When the Simulation finishes a run successfully, this is the state displayed. In this state you can view and refine plans or return to editing the mission.
- Error: When the Simulation run is unable to complete successfully and is not manually cancelled by the user, this is the state displayed. A message with details about why the error occurred is displayed in the error message hover-textbox.
Run a Simulation
After you have defined the interventions and are still in the Edit stage, SENSA Fabric allows you to run simulations that provide insights about which plans (comprised of one or more interventions) are most likely to achieve the mission goal.
Following the running of the simulation, you can view the generated plans, then choose to either continue editing the Interventions or move the Mission into the next stage, Refine, where a domain expert provides supervised learning by evaluating the result of the simulation (plans). Then the simulation may be run again with the retrained model, and new plans are derived until plans are selected for deployment. While the simulations may be run without defining an action, interventions require an Action to be deployed.
From the campaign's Summary tab, click the Mission name to open it.
Tip: To open a campaign, from the Console, make sure you've selected your active project, then click Campaigns in the left menu panel. Click the campaign to open it.
The Mission opens to the Interventions tab. You can toggle between that and the Mission Control from the top toggle.
In the Workflow panel on the right, if the status is Edit, you can click the SIMULATE button to open the Simulation Configuration panel.
NOTE: If you are returning to the Simulate stage and a review has not been completed, you must first click EDIT or REFINE to enable the SIMULATE option.
Configure the simulation:
- Review the list of attributes; deselect attributes you do not want to include in the simulation.
- Click Next at the bottom left.
- Review the default settings for the simulation. These impact how long the simulation will take to run and the quality of the plans generated.
- Review/change the Number of Iterations (Default = 1000). This represents the number of times a training gets run before an optimal model is generated. NOTE: You cannot enter a negative integer, exponential notation number (1e3) or positive integers greater than 1000 in this field.
- Review/change the Cohort Sample Size (Default = 1000). This is the number of records to run the simulation on. The records come from a random sampling of the records in the Profile selected for the Cohort. NOTE: You cannot enter a negative integer, exponential notation number (for example - 1e3) or positive integers greater than 10000 in this field.
- Click Next at the bottom left.
- If you want to save these settings for future simulation runs check the box "Save Settings".
- Click SAVE at the bottom of the configuration panel.
The Mission status changes from Edit to Simulate, and the simulation visualization begins running on the Interventions tab. The view automatically switches to the simulations tab where the visualization is running.
Simulation visualization
After you initiate the mission simulation, a dynamic visualization of the simulation is displayed. At the top right a status bar shows the progress of the simulation.
Click STOP beside the status bar or open the Workflow panel at the far right by clicking left-facing caret; then click STOP in the bottom panel to pause the simulation progress.
The Simulation passes through 3 statuses:
- Initializing: The data is being loaded.
- Training: The simulation is running as described below.
- Planning: The plans are being generated by the simulation.
- Completed: The simulation is complete and you can now view or refine plans.
The Simulation visualization display is shown as follows (moving from left to right):
On the far left the Mission Goal card is displayed.
To the right the intervention cards for the mission are displayed (click on a card to see the intervention details displayed in the top left panel):
- Intervention cost is top left on each card.
- Intervention name/description is in the center of each card.
- At the bottom the ratio displayed shows the number of successful outcomes from the intervention over the number of records that the simulation has affected. These values are dynamically adjusted during the simulation.
- A progress bar across the card top show the number of effective outcomes for the intervention. This bar is dynamically adjusted during the simulation.
To the right of the intervention cards is an event threshold with the cohort records represented as points of light on the right of that threshold. As the cohort records are processed, the points move across the threshold to the intervention cards they have been assigned to on the left (dynamically adjusted throughout the simulation)
You can click a card to view the intervention details.
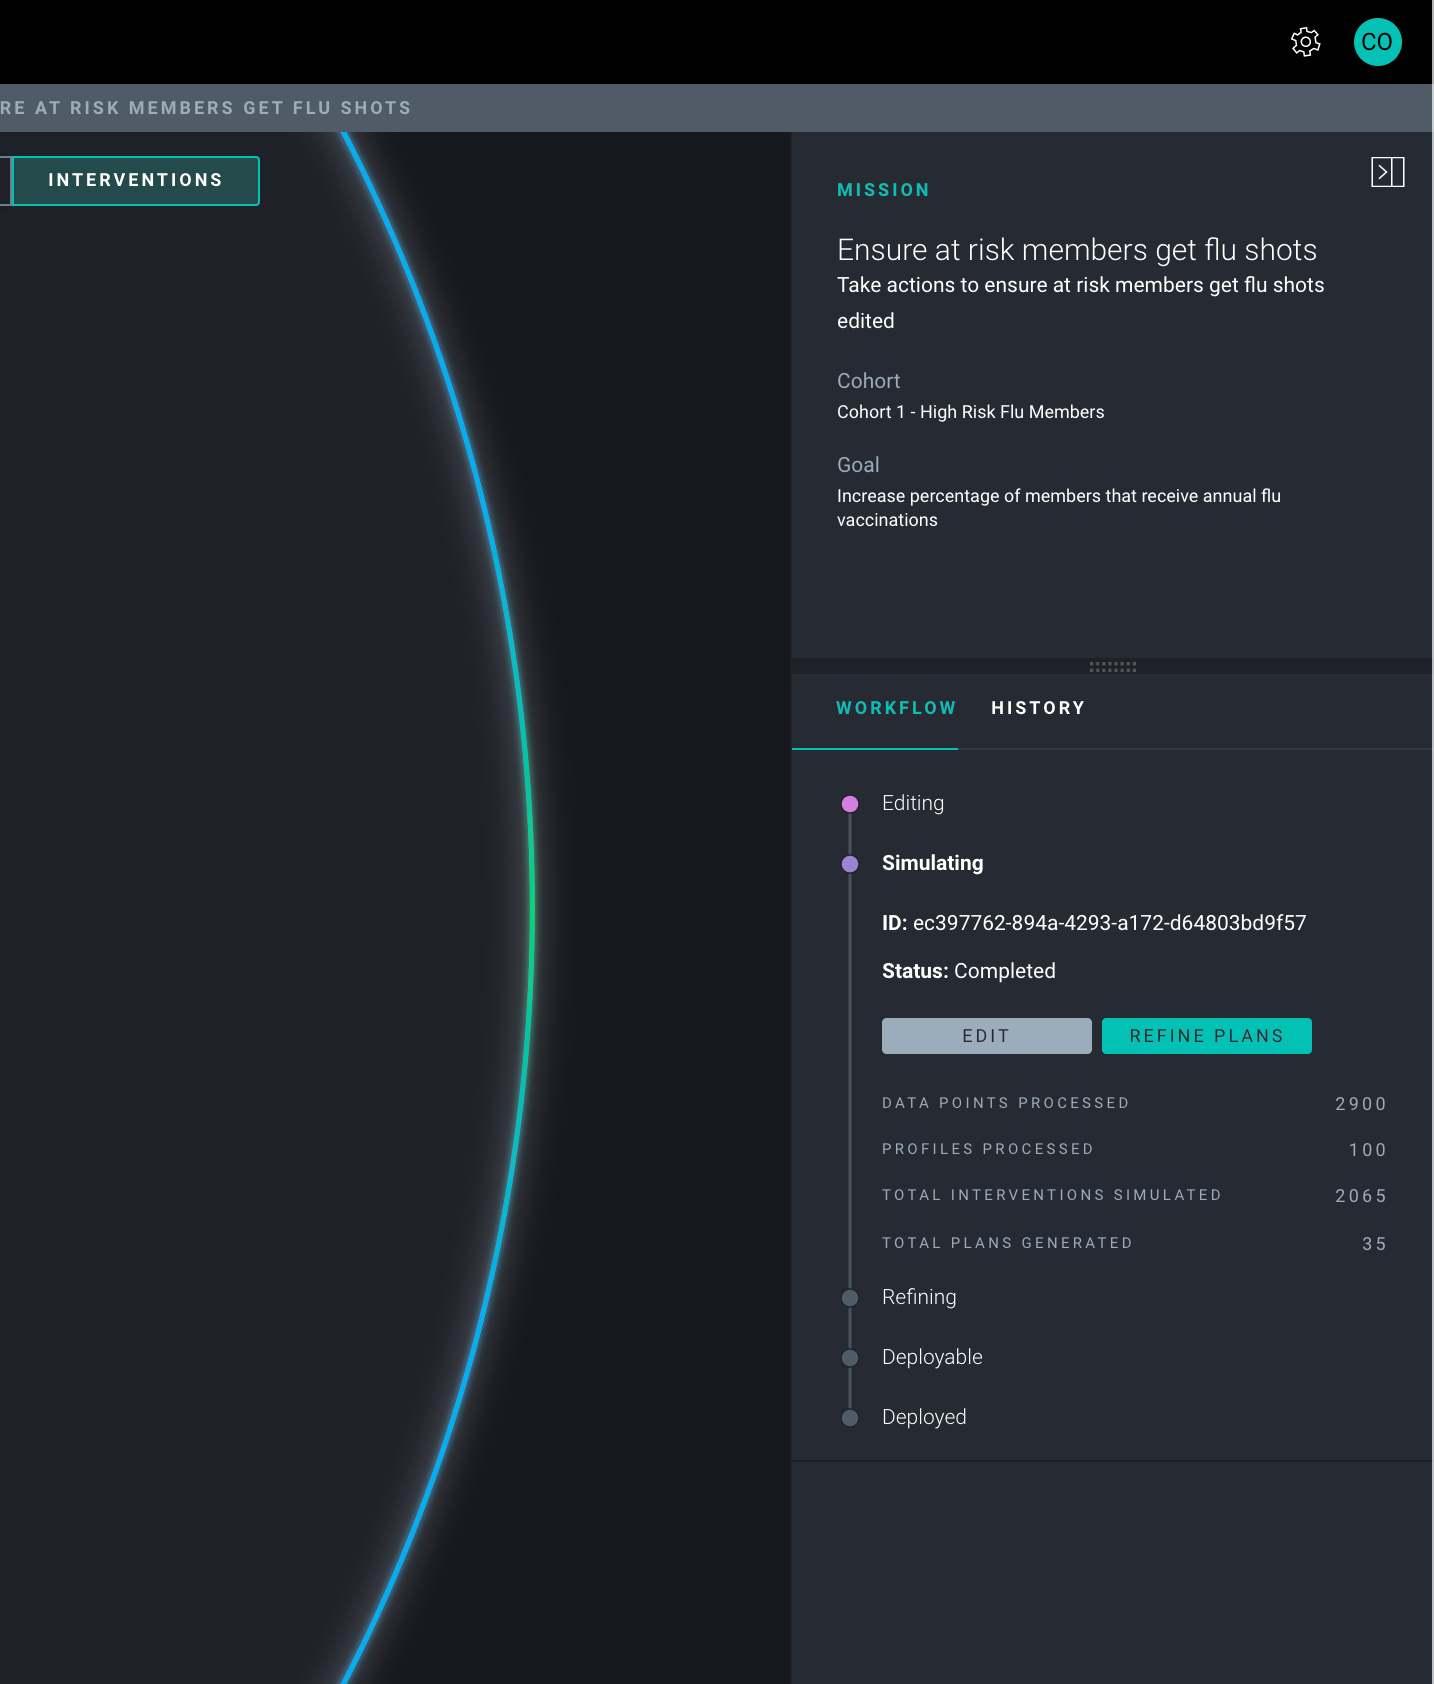
The far right Workflow panel is automatically hidden during the simulation. Click the arrow at the top right to expose it. This panel provides a summary of the mission at the top (Mission description, cohort, and goal) and the mission lifecycle actions and statuses in the bottom panel.
The ID and status of the Simulation is displayed under the Simulating workflow stage. When the status is COMPLETED, buttons are activated that allow you to return to EDIT the Mission or you can move on to REFINE PLANS. The buttons are not active when the simulation is in the TRAINING status.
In addition, a set of metrics from the simulation are displayed:
- DATA POINTS PROCESSED
- PROFILES PROCESSED
- TOTAL INTERVENTIONS SIMULATED
- TOTAL PLANS GENERATED
View plans
When the Mission simulation has completed, you can view the generated plans from Mission Control. Use the Group 1 and 2 drop-downs at the top to select the attributes that are used group the plans in the plan view.
A horizontal bar graph displays an overview of the simulation results for the plan groups you selected. The simulation result or Total Count is presented as a blue overlay. This is the total number of profiles within a given cohort group that reached the goal. The Baseline Group Count represented by the gray line is the Simulated Count or the total number of profiles within a given cohort group that were selected for the simulation. At the end of each line the Reached Goal percentage is displayed. This is simply the percentage represented by the two counts. When you hover over this percentage, a detail box displays:
Intervention name and cohort group assignments for the plans
Total Count: the total number of profiles within the cohort group that reached the goal over the number of profiles that were assigned to the intervention.
Reached Goal: the percent of profiles in the group assigned to the plan that reached the goal
The View Plans button: opens the plan details page, which displays a ranked list of interventions
When you click the View Plans button before clicking Refine in the Workflow panel on the far right, you are able to view the results, but not refine them.
Common practice is to edit interventions, run simulations, refine the generated plans, and then rerun the simulation and refine plans again.
To edit the intervention details click Edit in the Workflow panel.
When you are ready to run the simulation again to see new plan results, click Train in the Workflow panel.
When you have refined and re-simulated all of the plans and are satisfied with the intervention plans, click Done in the Workflow panel.
Refine Plans
In the Refine stage, the plans and recommendations provided by the simulation are reviewed by a domain expert to provide a human-in-the-loop for retraining the model and rerunning the simulation to ensure that the best intervention plan can be determined.
When the simulation has completed, the status at the top right is "Completed".
Open the Mission Control tab (at the top center). Select the groups that have been preset to organize the results.
The groups selected provide the y-axis designation for the horizontal bar graph display.
The x axis shows the simulated results for each group selected.
Gray bar = CohortGroupCount - Groups within the cohort for that mission
Blue bar = SimulationGroupCount - Resultant group for which plans were generated from simulation.
noteA single Profile may be assigned to more than one plan.
Click the arrow at the top right to expose the left panel with the intervention summary at the top and the Workflow/History panel at the bottom.
In the Workflow panel click REFINE.
Hover over the percent displayed at the right end of the bar graph to view the number of profiles selected for the group, the percentage that reached the goal (according to the simulation), and to access the View Plans button.
Click View Plans. (You can click View Plans without first clicking Refine to view the plans but not refine them.)
The Plans Table is displayed. Plans are composed of one or more interventions (in cases where multiple interventions are required to meet the mission goal).
The Plans table provides the following data and options for reviewing the plan:
- ADD checkbox: Click in the checkbox to select plans that you want to refine and run simulations on (or deploy)
- Priority: The plans are ordered from most effective to least effective by the simulation. You can reorder the plans that have been selected in the ADD column by entering the number that reflects the new ranking. This selection and reordering refines the model.
- Initial Rank: Displays the simulation rank for the intervention
- Plan Id: System assigned identifier for the Mission Plan
- Intervention(s): Intervention titles from the Mission that have been employed by the simulation for this particular Cohort Group based on the defined attributes of that group
- Profiles (#/%): The number of profiles affected by the intervention/the percent of members in the sample size affected by the intervention
- Cost: The average cost of the interventions in the group based on the cost assigned when the intervention was configured (Note: Cost is not a monetary value.)
Select and reprioritize the plans displayed for the group segment by entering new rank numbers. You can alter the rank using one of the following methods:
- Enter an integer in the open textbox to represent the desired rank for each plan. Integer may not be repeated. The highest ranked item may be set as 0 or 1.
OR
- Set your cursor in the empty box and click the up and down errors to set the desired rank. Integers may not be repeated. The highest ranked item may be set as 0 or 1.
Click Refine Plans at the bottom of the page.
Review other plans for other groups by following steps (2-8). It is not required to review all plans before re-running a simulation.
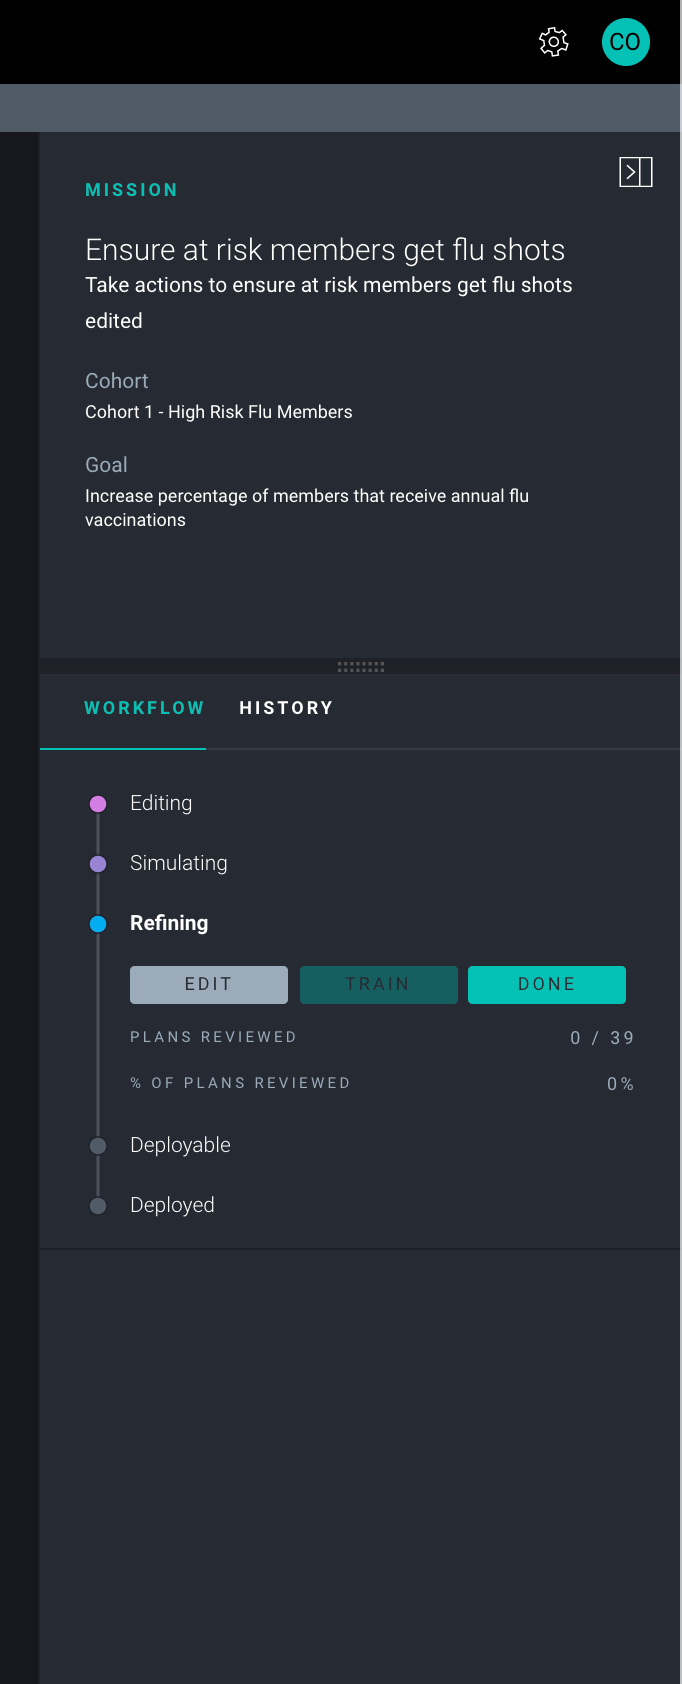
While you refine plans the workflow panel on the far right displays actions and metrics under the REFINING status marker.
Buttons that are activated allow you to:
EDIT: Make changes to the mission
TRAIN: Rerun the simulation using the data from the refining process (not active until all of the plans have been refined)
DONE: Completes the refining processes
The metrics displayed are:
PLANS REVIEWED
% OF PLANS REVIEWED
After plans have been reviewed, the simulation may be rerun and those plans reviewed until a result set meets the business requirements for deployment.
If an issue is identified and additional interventions are required, move the Mission back into the Edit stage. Note, however, that when you move from Refine back into Edit, any refinements made will be lost. Adding or editing interventions changes the model, and any new simulations run will be based off those changes.
Refinement Status
When you begin refining plans, a progress bar shows the various states of the refinement job. Possible statuses include:
Unknown: Is displayed when the refinement job has been kicked off and is the initial stateInitializing: Signifies that the Model is initializingWarm-start: Signifies that the Model is re-training based on reviewers inputsPlanning: Signifies that Plans are being generated for refinement
Plan History
The History tab is located beside the Workflow tab on the bottom right panel.
Click the History tab to display a list of simulation runs.
A reach-bar depicts the level of completion that the Simulations reach.
Simulations that reach the Completed status show 100% complete.
Other errors may also be displayed.
Click in the radio button to select a plan generation set and view the results in the center panel.
Compare simulations
To view a comparison of two historic simulations:
- From the History tab toggle the Compare Simulations button to ON.
- The most recent simulation is selected for comparison by default (The box is checked.)
- Click the box of a second historical simulation to launch the comparison.
- In the center panel the comparison of the simulations is displayed.
- Hover over the percentage difference statistic (by the red arrow) at the end of each row in the bar graph to view a summary of the comparisons or to expose the Refine Plans button.
- Click Refine Plans to reorder the plans from both simulations displayed intermingled based on their success rates for the cohort groups represented.
- Click Refine Plans in the bottom panel when you are finished reordering.
- Select another result set from the bar graph and continue.
- When you are done refining the compared plans click back to Workflow tab (from History) and click DONE (or EDIT to make changes to the mission configuration).
- (Optionally) Click TRAIN to rerun the simulation with the new refinement information.
Edit interventions
To edit the details of an intervention following simulation run or plan refinement:
- From the Mission Control tab at the center top click the arrow at the top right to expose the left panel with the intervention summary at the top and the Workflow/History at the bottom.
- On the Workflow tab click EDIT.
- Switch to the Interventions tab.
- Click any intervention box.
- The intervention configuration panel opens on the left where you can edit the intervention components.
- Click SAVE at the bottom of the panel to save your changes.